Issue 1 | Bayesian thinking, building base rates with IRIS 2025 & cyber prediction markets
How to Start with What You Have and Get Better Over Time

In This Month’s Issue:
📖 Book update: progress on data collection, vetting, and the three-source model for CRQ
🧠 Why every risk analyst should think like a Bayesian (and how to start)
📊 How to use IRIS 2025 to establish base rates and build sector-specific priors
🛠️ Step-by-step GenAI prompts for applying IRIS data in your own models
📗 Book Excerpt: My Experience with Prediction Markets
📚 What I’m reading: favorite picks on risk sin eater, security-first controls, and financial discipline in CRQ
🗂 From the archives: two blog posts on pushback in risk analysis and decision framing
🙋 Reader Q&A: what to do when your org has 1,500 risks in the register
Hey there,
Welcome to Issue 1! Thanks for being part of this journey from the very beginning. This newsletter accompanies my upcoming book "From Heatmaps to Histograms: A Practical Guide to Cyber Risk Quantification" (Apress, early 2026). Each month, I share practical techniques, behind-the-scenes insights from the book writing process, and field-tested CRQ tactics that help you build better risk models.
If you missed my launch post (Issue 0), you can check it out here. I shared the full abstract of the upcoming book as well as a guide to your first quantitative cyber risk assessment.
📖 Book Update: Progress on the Big Middle
First, a quick update on the book project. The deal is signed, and we're targeting early 2026 for publication. Pre-order links should be available later this year (likely Q4 2025), and I'll share those with you as soon as they're live.
I'm currently focused on what I thought would be the most challenging section: data collection, vetting, and preparation for quantitative analysis. I tackled this middle chunk first because getting the foundation right makes everything else click into place.
The Three-Source Framework
One of the core principles I'm building the book around is what I call the "three essential data sources" for cyber risk quantification:
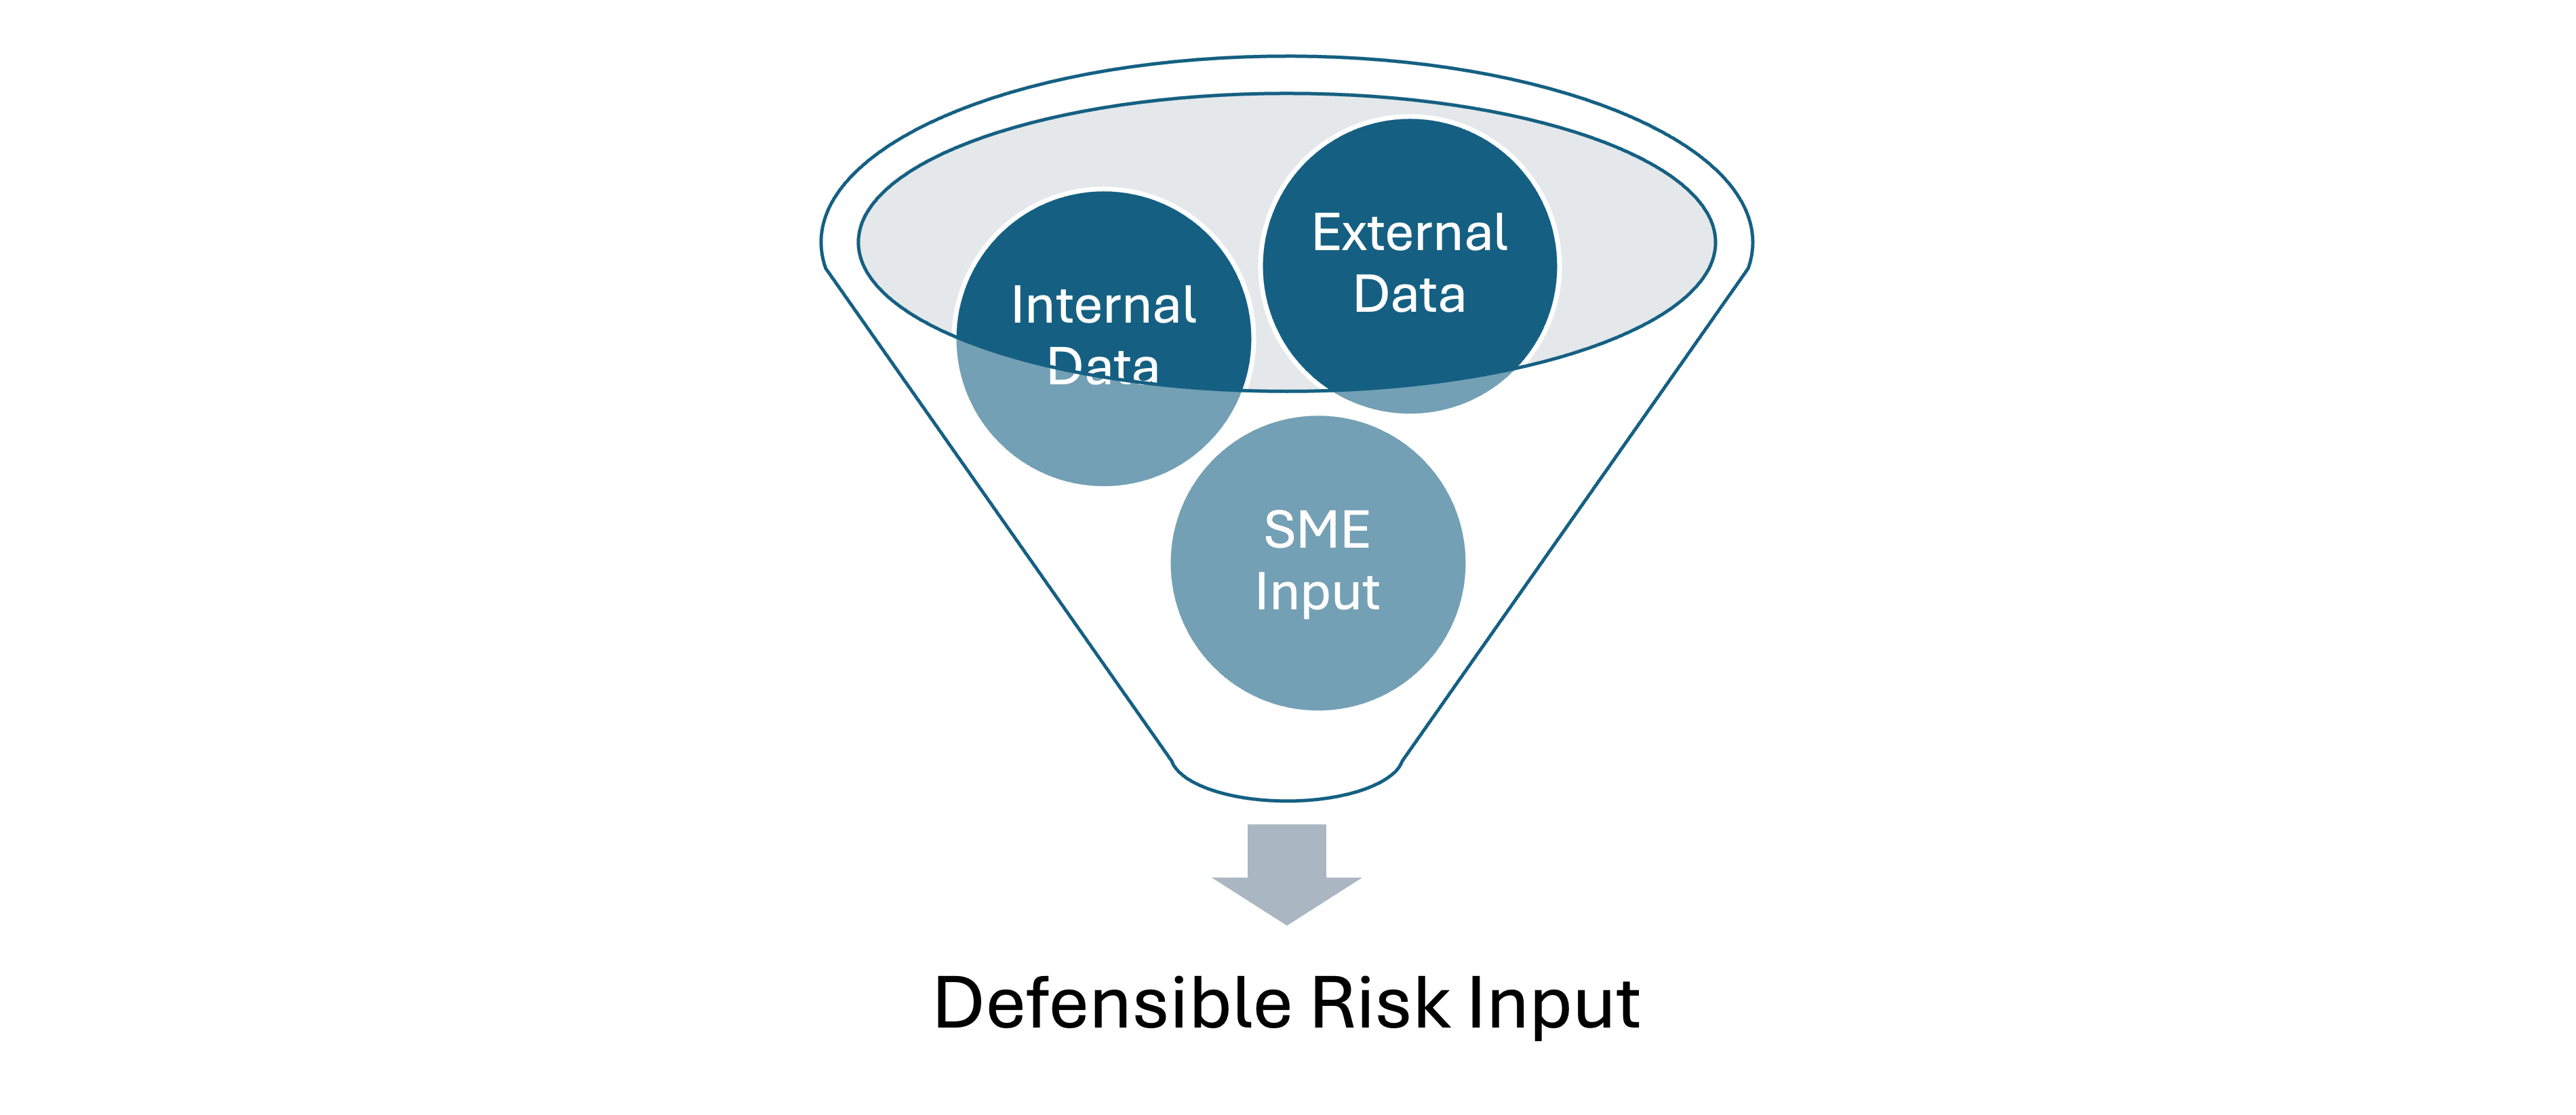
External data provides industry context and base rates - breach frequencies, cost studies, enforcement patterns. Your "what typically happens to organizations like ours" baseline.
Internal data grounds everything in your specific reality - incident logs, actual recovery times, real costs from past events. Your "what actually happens here" update.
Subject matter expert (SME) input bridges past and future with forward-looking judgment about current threats, new controls, and changing conditions. Your "what's likely to happen next" forecast.
The magic happens when you systematically combine all three. Each source has blind spots, but together they create something far more reliable than any single input.
Getting Unstuck
People get stuck on data collection for three main reasons: the "perfect data myth," not knowing where to look, and analysis overwhelm when facing messy information. I'm addressing each with practical methods that work with real-world constraints.
Vetting and Blending
The book includes a simple framework for evaluating any data source in minutes, plus time-tested quality adjustment methods borrowed from fields like climate science, nuclear safety, and actuarial science that specialize in high-stakes decisions under uncertainty. When you find that vendor survey claiming "average breach cost is $2.1M," you'll know exactly how to convert it into an honest range that reflects what you actually know.
For combining sources, I use a math-free Bayesian approach - start with your best external baseline, then systematically update it with internal evidence and expert judgment. Like checking traffic before heading to the airport, but structured for risk data.
This foundation work enables everything else - scenarios, simulations, and actual business decisions. Getting the data piece right makes the rest straightforward.
🧠 Why Every Risk Analyst Should Think Like a Bayesian
Speaking of Bayesian thinking… let me share a tool that's transformed how I approach risk analysis, and I believe it can do the same for you. It’s more than a tool, though; it’s a way of thinking.
You don't need to be a statistics wizard to benefit from Bayesian thinking. Yes, there are sophisticated mathematical applications that belong in any serious risk analysis toolkit, but today I want to focus on Bayesian reasoning as a mental model. This shift in mindset can revolutionize how you frame risk analyses, keep projects focused, and avoid the dreaded "boiling the ocean" syndrome.
More importantly, if you embrace this thinking early, you'll sidestep the common CRQ myths that paralyze many analysts:
Believing you need to collect ALL the data before starting
Thinking a risk analysis is invalid without perfect information
Getting stuck in analysis paralysis
Bayesian thinking also acts as a natural defense against cognitive biases we all carry: overconfidence, anchoring, and the IKEA effect (overvaluing something because we built it ourselves).
Bayesian Thinking as a Mental Model
Prior: Your initial belief or estimate, based on current knowledge, experience, or data.
Evidence: New information, observations, or data relevant to the belief.
Posterior: Your updated belief after factoring in the new evidence. It becomes the new prior for next time.
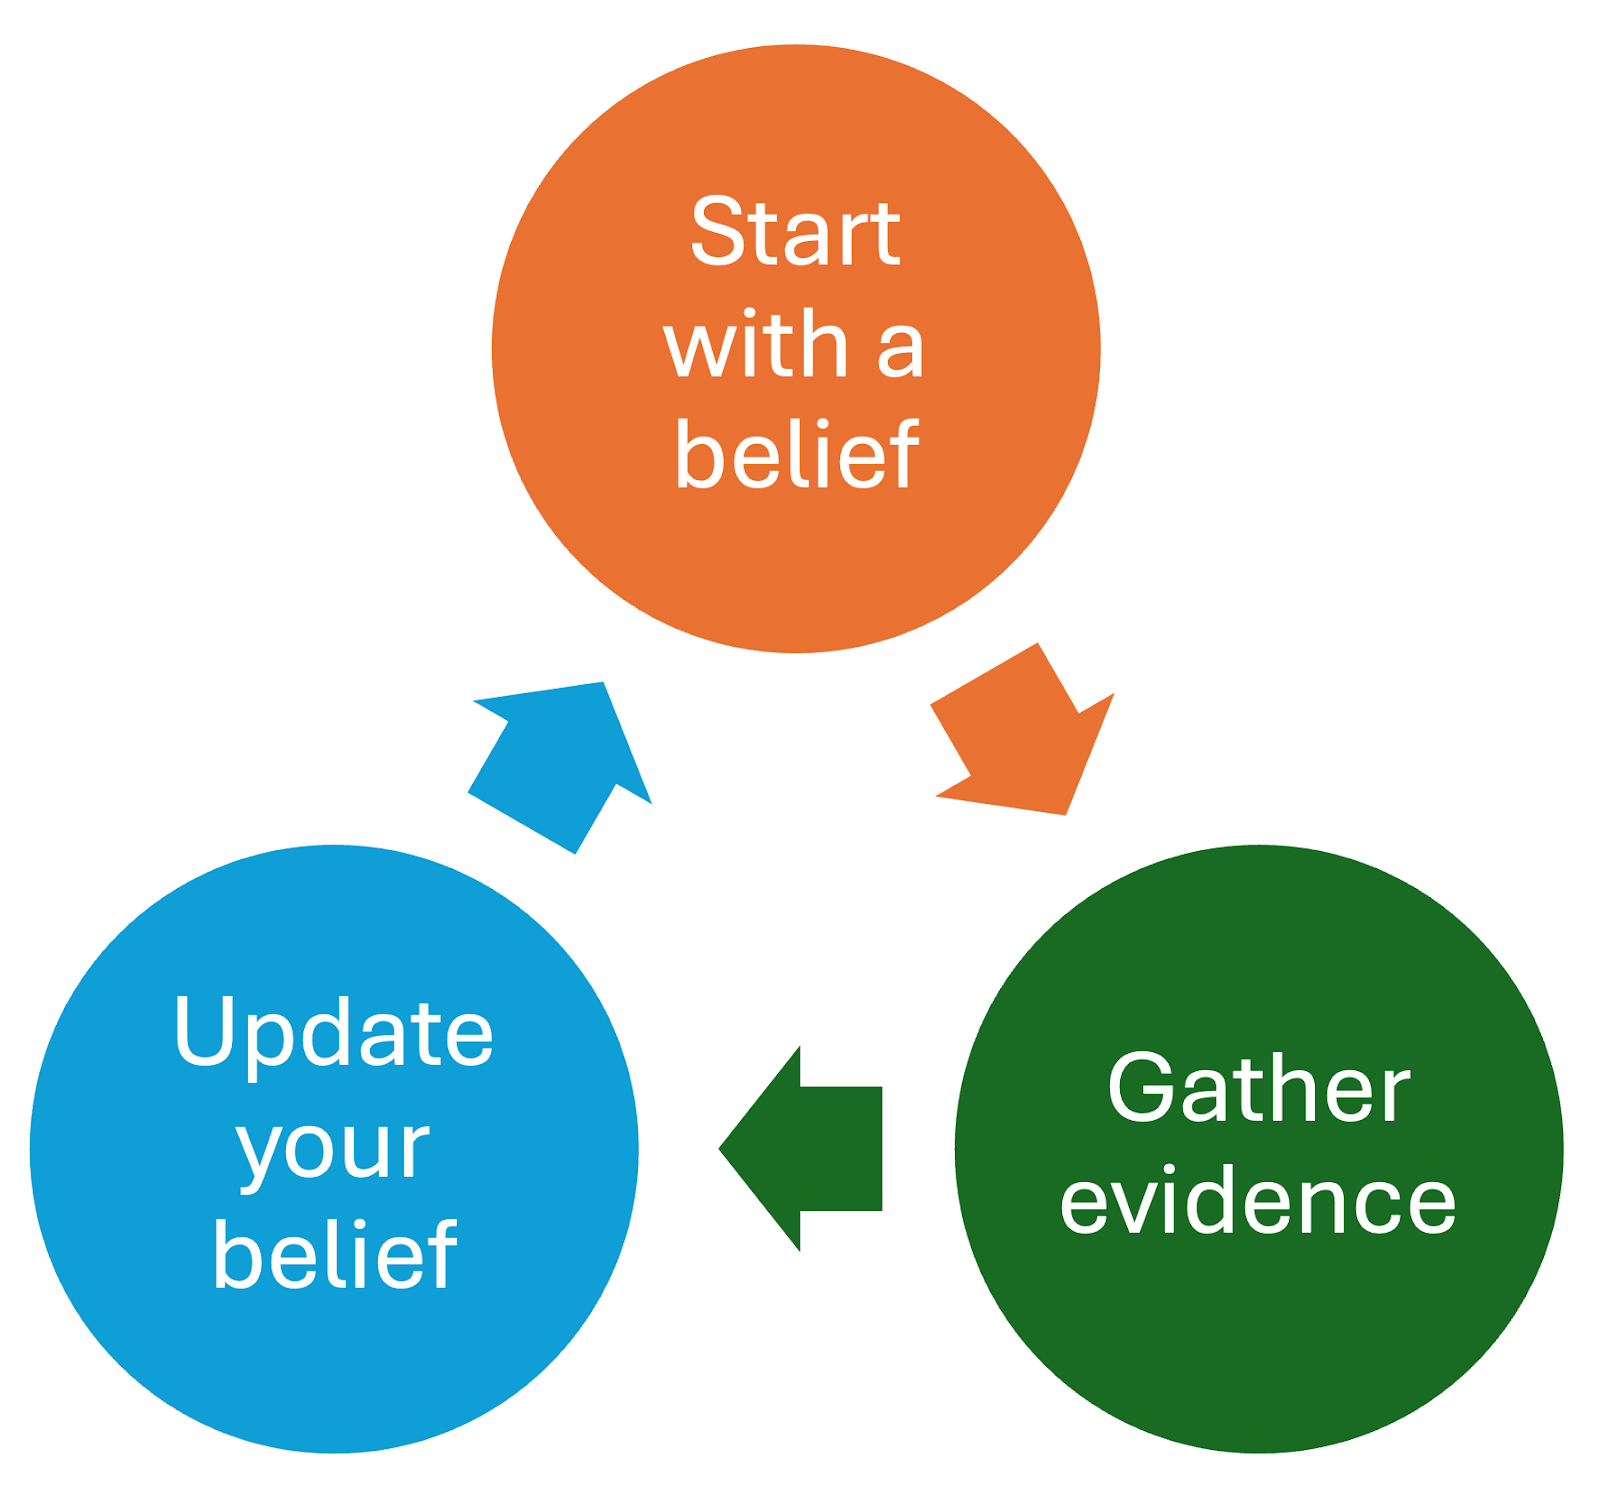
The Process:
Start with a belief: based on what you already know (your prior).
Gather evidence: actively look for new data or observations.
Update your belief: revise your estimate in light of the evidence.
Repeat : treat your updated belief as the new starting point for the next cycle.
The beauty is in the cycle: today's posterior becomes tomorrow's prior. You're always learning, always updating, never claiming to have the final answer.
A Real-World Example
Let's say you're assessing the risk of a data breach at your company.
Your Prior: Based on industry reports, you estimate a 15% chance of a significant breach in the next year.
New Evidence: Your security team reports they've detected 3x more phishing attempts this quarter, and a recent vulnerability scan found several unpatched systems.
Your Posterior: This evidence suggests higher risk. You update to around 25% chance of a breach.
Next Cycle: A month later, phishing training shows dramatic improvement in employee click rates, and all critical patches are applied. Your posterior (25%) becomes your new prior, and with this positive evidence, you adjust down to around 18%.
Notice what happened? You started with imperfect information, made decisions, gathered more data, and refined your thinking. You never stopped to collect "all possible data." You started with what you had and improved from there.
This is exactly how effective risk analysis works in the real world.
The key insight: Without this mindset, beginners often try to "get it perfect" before they start and never actually do a risk analysis. Bayesian thinking gives you permission to start with what you have and get better over time. You're not ignoring uncertainty, you're structuring it. That's what makes it so powerful for real-world risk.
📊 Using IRIS 2025 Data as Your Risk Analysis Starting Point
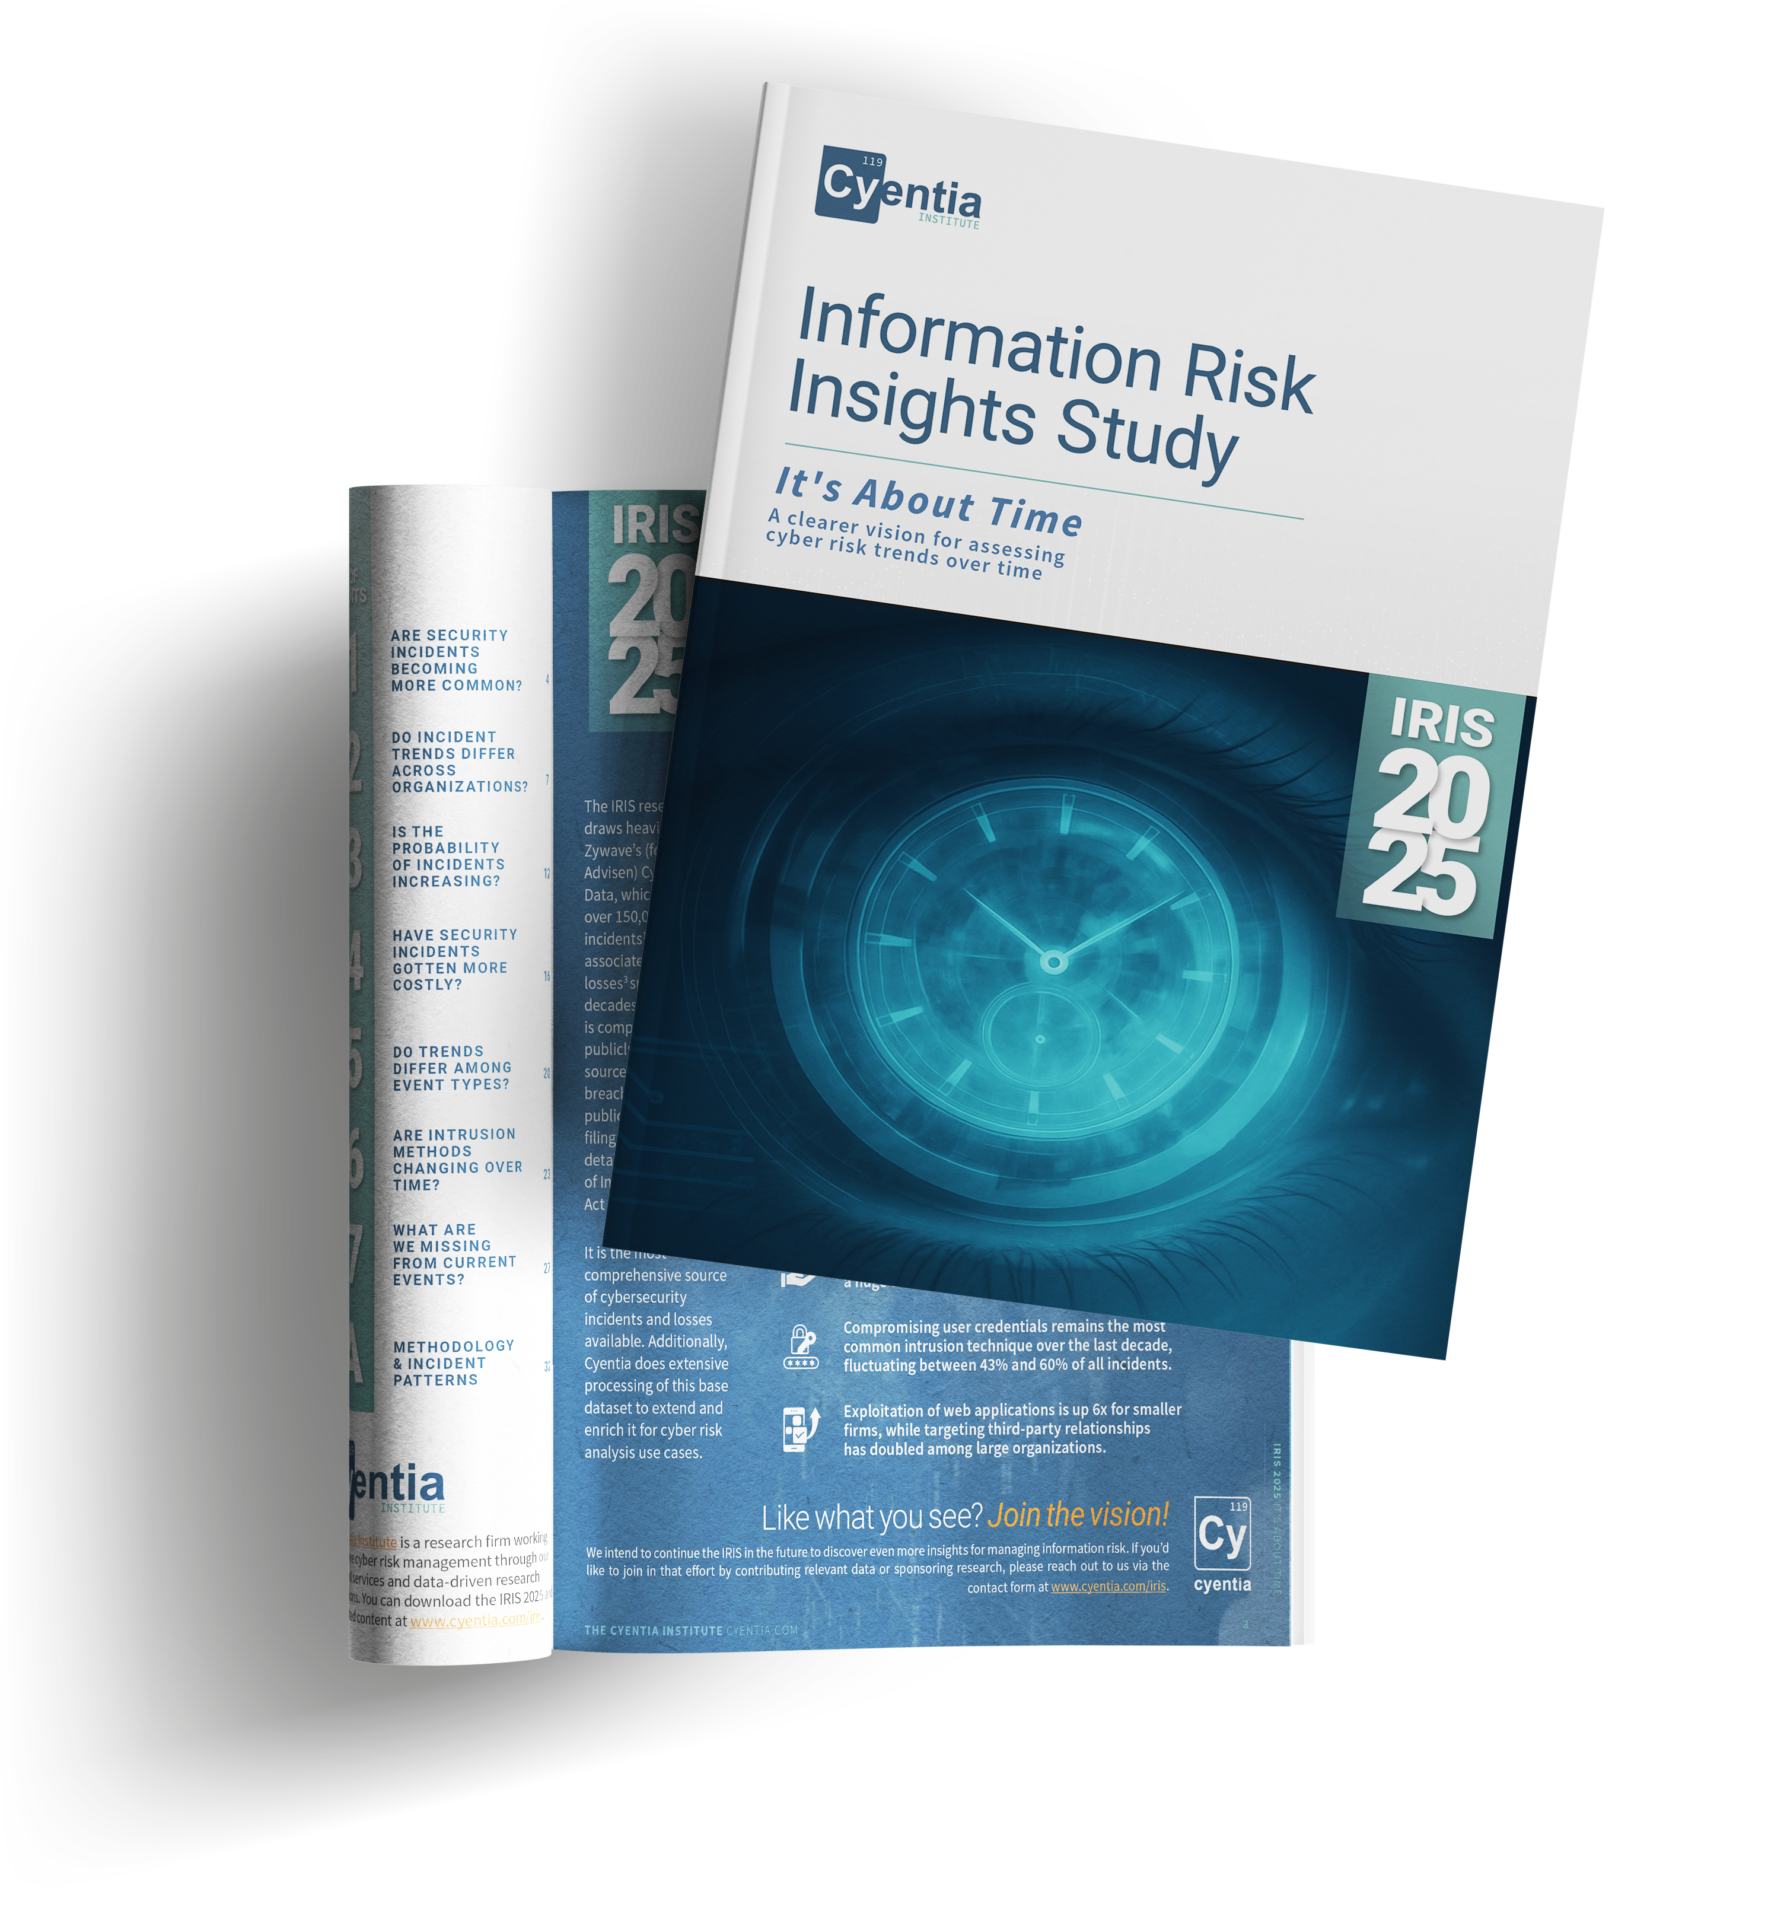
Now that you’re thinking like a Bayesian, it’s time to put that mindset to work. The Cyentia Institute’s IRIS 2025 report is one of the best starting points we have for establishing base rates, those initial priors that anchor a quantitative risk analysis before we ever touch a scenario or a simulation.
Instead of beginning with a guess, or a color on a heat map, you can start with probabilities grounded in what has happened to organizations like yours. This is where Bayesian thinking stops being abstract and starts being practical. You’re not trying to be perfect. You’re trying to be honest about what you know, and then improve from there.
One important caveat up front. IRIS focuses on significant cyber incidents that make their way into the public record. That means it should be treated as a lower-bound prior, not a complete census of all incidents. Over time, these priors should be updated with your internal incident data and structured expert judgment. That’s not a limitation of the method. That’s the method working as intended.
Below are four practical ways you can start using IRIS 2025 right now.
Four Ways to Use IRIS 2025 Right Now
Use Case 1: Establish Your Organization’s Base Rate
Let’s start by estimating a base rate for a hypothetical healthcare organization with $800 million in annual revenue. This base rate represents the annual probability that the organization experiences at least one significant security incident, meaning an event that would reasonably be expected to require public disclosure.
First, find your revenue tier. In IRIS 2025, turn to Page 12, Figure 7.
Next, locate the appropriate category. For our example organization, that’s the “$100M to $1B” revenue band.
Now read the chart. Follow the line for this revenue tier to the rightmost point, which corresponds to 2024.
Based on a visual reading of the chart, organizations in the $100M to $1B revenue range appear to face roughly an 8-9% annual probability of a significant, publicly disclosed cyber incident.
That range becomes your Bayesian prior for modeling significant cyber incidents. It’s not a final answer, and it’s not a claim of precision. It’s a reasonable starting point.
⚠️ These probabilities reflect publicly disclosed events, not all security incidents. I strongly recommend working with ranges rather than single point estimates to account for both reading uncertainty and real-world variability.
🔍 GenAI Prompt:
[upload the PDF into the prompt]
See the attached IRIS 2025 report, Page 12, Figure 7. Help me extract the incident probability range for an organization with $800M in annual revenue. Walk me through how to read the chart and provide a reasonable range rather than a precise percentage. These probabilities are for significant cyber incidents requiring disclosure.
Use Case 2: Build Sector-Specific Frequency Models
Now let’s tailor that base rate to your industry. We’ll stay with the same example, a healthcare organization with about $800M in annual revenue.
Before we do the math, a quick note on what we’re doing conceptually. IRIS gives us two useful ingredients: an overall base rate by revenue tier, and a sector-relative likelihood factor. IRIS does not spell out a single “official” way to combine those two, so what follows is a practical heuristic for building a firm-specific prior. It’s simple, transparent, and easy to update later when you bring in internal data.
Here’s what we’ll use from IRIS 2025.
First, the base annual incident probability by revenue tier from Figure 7 on page 12. This is our starting point for estimating the likelihood of at least one significant incident entering the public record.
Second, the sector relative probability factor from Appendix 3, Figure A1 on page 34. For Healthcare, the factor is 1.34x. Think of it as “more or less likely than the median sector,” not a magic conversion that makes the data perfect.
Step-by-Step Exercise
Start with your base rate. From Figure 7 (p. 12), organizations in the $100M to $1B revenue range appear to have roughly an 8 to 9 percent annual probability of a significant, publicly reported incident.
Find your sector factor. In Appendix 3, Figure A1 (p. 34), Healthcare’s relative probability factor is 1.34x.
Apply the factor to your range.
Lower bound: 8% × 1.34 ≈ 10.7%
Upper bound: 9% × 1.34 ≈ 12.1%
So for a healthcare organization with roughly $800M in annual revenue, a reasonable firm-specific prior for a significant, publicly reported incident is about 11 to 12 percent per year, using this simple heuristic.
One last bit of humility, because it matters. If you compare this derived prior to the healthcare time series elsewhere in IRIS, you may see differences. That’s not a contradiction. It’s a reminder that we’re combining two different lenses on the data. In practice, you treat this as a starting point, then update it with what you know about your organization.
🔍 GenAI Prompt:
Using IRIS 2025, help me calculate a sector-adjusted incident probability range. My organization is in the Healthcare sector with $800M annual revenue.
From Figure 7 on p. 12, extract the base annual incident probability range for organizations with $100M–$1B in revenue.
From Appendix 3, Figure A1 on p. 34, find Healthcare’s sector relative probability factor (1.34x).
Apply that factor to both ends of the base probability range, show each calculation step, and clarify these probabilities are for significant cyber incidents that enter the public record.
Use Case 3: Sector and Revenue Loss Benchmarks
Now let’s talk about impact. Frequency tells you how often you might get hit. Loss magnitude tells you what it looks like when you do.
This is also where it’s easy to accidentally overclaim what the data can do. IRIS gives us two useful, but different, views of loss magnitude.
One is organized by revenue tier (Table 1 on page 16). The other is organized by sector (Appendix 3, Figure A3 on page 35). IRIS does not provide sector “loss multipliers,” and it does not prescribe a single way to combine the two into a perfectly sector-and-revenue-conditioned loss estimate. So in this issue, we’re going to keep it honest and use the sector loss statistics directly as our starting point, then refine later with internal data.
Here’s how to do it.
Step-by-Step Exercise
Start with revenue-tier loss benchmarks (Table 1, p. 16). For organizations with $100M to $1B in annual revenue, IRIS reports:
Median (50th percentile): $466.7K
High-end (95th percentile): $12.3M
These numbers are useful because they keep you anchored to firm size, but they’re not sector-specific.
Now pull sector loss benchmarks (Appendix 3, Figure A3, p. 35). For Healthcare, IRIS reports sector-level loss statistics for significant, publicly reported incidents. Use those values as your sector prior for impact.
Your Result: For a healthcare organization, a reasonable starting point for loss magnitude is:
Typical loss (median): approximately $557K
Extreme loss (95th percentile): approximately $14M
A quick but important label. These sector figures are benchmarks at the sector level. They’re not conditioned on revenue tier. That’s fine for a starting point, and in practice it’s often what you want early on, because it is easier to defend and easier to update. If you have internal incident cost data, or a strong reason to believe your organization is systematically above or below the sector, this is exactly where Bayesian updating earns its keep.
🔍 GenAI Prompt:
Using the IRIS 2025 report, help me extract defensible loss magnitude benchmarks for significant cyber incidents for a Healthcare organization.
From Table 1 on p. 16, extract the median (50th percentile) and high-end (95th percentile) loss values for organizations in the $100M–$1B revenue range.
From Appendix 3, Figure A3 on p. 35, extract the Healthcare sector median and 95th percentile loss values.
Explain the difference between revenue-tier and sector benchmarks, and clarify that IRIS reports on significant incidents that enter the public record. Use ranges or “approximately” language rather than implying precision.
Use Case 4: Factor in Sector Risk Trajectory
So far, we’ve treated risk as a snapshot. A base rate. A set of priors. That’s necessary, but it’s not sufficient. Risk is not static, and one of the most useful questions you can ask is whether your sector’s risk profile is trending upward, stabilizing, or starting to bend downward.
IRIS 2025 gives us a way to look at that over time.
Step-by-Step Exercise
To understand sector trajectory, turn to Page 13, Figure 8 in the IRIS 2025 report and focus on the Healthcare panel.
This chart shows the estimated annual probability of a significant, publicly reported cyber incident over time for healthcare organizations. The exact values are not tabulated, so what follows is based on visual interpretation of the plotted trend rather than precise point estimates.
Over the long term, the direction is clear. Healthcare incident probability rises steadily from the late 2000s through the early 2020s, moving from low single-digit percentages to roughly nine percent by the early part of this decade.
In the most recent years shown, however, the pattern changes. From about 2022 through 2024, the healthcare curve flattens and shows signs of stabilization rather than continued acceleration. The most recent value shown is approximately 9.1 percent in 2024.
How to Interpret This
There are two signals here, and both matter.
The long-term signal tells you that healthcare cyber risk increased substantially over the last fifteen years. That context helps explain why today’s base rates are meaningfully higher than they were a decade ago.
The short-term signal is more cautious. Recent years suggest a plateau, or at least a pause in growth. That does not mean risk is going away, and it certainly doesn’t mean it can’t rise again. It does mean you should be careful about assuming continued straight-line growth into the future.
Practical Takeaway
For forward-looking planning, treat healthcare risk as elevated relative to the past, but not necessarily accelerating year over year. This is a reminder to revisit your priors regularly. IRIS is published on a multi-year cadence, and sector trajectories can and do change.
Bayesian thinking fits naturally here. Today’s posterior becomes tomorrow’s prior. When new data arrives, you update. You don’t lock in assumptions simply because they once felt directionally true.
🔍 GenAI Prompt:
Using IRIS 2025 Page 13, Figure 8, help me analyze the risk trajectory for healthcare organizations from 2008–2024. I need to determine whether the trend is rising, falling, or stabilizing and estimate the long-term rate of change as well as the short-term directional signal. Use this to inform 2025+ planning assumptions.
Final Output: Your Sector Risk Profile
At this point, you’ve built a defensible, research-backed starting profile for a healthcare organization with approximately $800 million in annual revenue. Nothing here is exotic. Nothing requires perfect data. It’s simply a structured way to turn published research into something you can actually use.
Here’s what that profile looks like.
Incident frequency
Based on IRIS 2025 Figure 7, organizations in the $100M to $1B revenue range appear to face roughly an 8 to 9 percent annual probability of experiencing at least one significant cyber incident that enters the public record.
Applying IRIS’s sector-relative probability factor for Healthcare as a practical heuristic, a reasonable firm-specific prior is approximately 11 to 12 percent per year. This is not an official IRIS statistic. It’s a transparent, derived starting point that can and should be updated with internal data and expert judgment.
Loss magnitude
For loss magnitude, IRIS provides sector-level benchmarks that are well suited for early modeling.
According to IRIS 2025 Appendix 3, Figure A3, Healthcare organizations show:
A median (typical) loss of approximately $557K
A 95th percentile (extreme) loss of approximately $14M
These figures reflect significant, publicly reported incidents at the sector level. They are not conditioned on revenue tier, and that’s intentional here. As a starting point, sector benchmarks are easier to explain, easier to defend, and easier to update once you incorporate your own incident cost data.
Risk trajectory
Looking at IRIS 2025 Figure 8, Healthcare risk increased substantially over the long term, rising from low single-digit probabilities in the late 2000s to roughly nine percent by the early 2020s.
In more recent years, the trend appears to flatten. The most recent estimate shown is approximately 9.1 percent in 2024, suggesting stabilization rather than continued acceleration. That doesn’t mean risk is declining, but it does mean you should be cautious about assuming straight-line growth into the future.
What This Means for You
Taken together, this gives you a usable, defensible risk profile:
Frequency: roughly an 11 to 12 percent annual probability of a significant, publicly reportable cyber incident
Impact: typical losses around $500K, with extreme but plausible losses on the order of $10M to $15M
Trajectory: elevated relative to the past, but not clearly accelerating year over year
More importantly, you now have inputs that support real decisions.
You can test whether proposed security investments meaningfully reduce expected loss. You can evaluate insurance retention levels against tail risk instead of gut feel. You can explain to executives not just that cyber risk exists, but how often it shows up, how bad it tends to be, and how that compares to what the business is willing to tolerate.
These are not final answers. They are informed starting points.
And that’s the whole point of Bayesian thinking. You don’t wait for perfect information. You start with what you can defend, then you update as you learn more about your own environment, your own controls, and your own incidents.
💡The Bayesian Unlock
Notice what's happening here: You're not using IRIS data as the end goal; something you skim once and never open again. You're using it as your informed starting point, then systematically updating with organization-specific evidence.
This prevents the classic risk analysis traps:
Starting with gut feelings instead of data
Ignoring industry baselines
Treating your organization as completely unique
Getting paralyzed by the need for "perfect" data
Your risk analysis becomes a conversation between industry research and organizational reality - exactly what Bayesian thinking is designed to handle.
🏠 Homework: Put This Into Practice
Your Assignment: Download IRIS 2025 and build your organization's risk priors using the GenAI prompts above.
Use the four exercises to calculate your organization's base rates
Try all four GenAI prompts - see how they help extract and organize the data
Document your priors - you'll need them as your Bayesian starting point
Compare your current risk assessments with research-backed priors - how do they differ from your existing estimates?
Bonus Challenge: Take your calculated ranges and ask yourself: "What organizational-specific evidence could move me up or down within these ranges?" This is exactly how Bayesian updating should work.
Remember: These aren't your final risk assessments - they're your informed starting points. The real power comes when you start updating these priors with your organization's specific threat intelligence, control effectiveness, and incident history.
📗 Book Excerpt: My Experiment with a Prediction Market
One of the cooler experiences in my career happened when I worked with Richard Seiersen, co-author of How to Measure Anything in Cybersecurity Risk and author of The Metrics Manifesto. Together, we set up a functioning prediction market at a large financial services company in San Francisco.
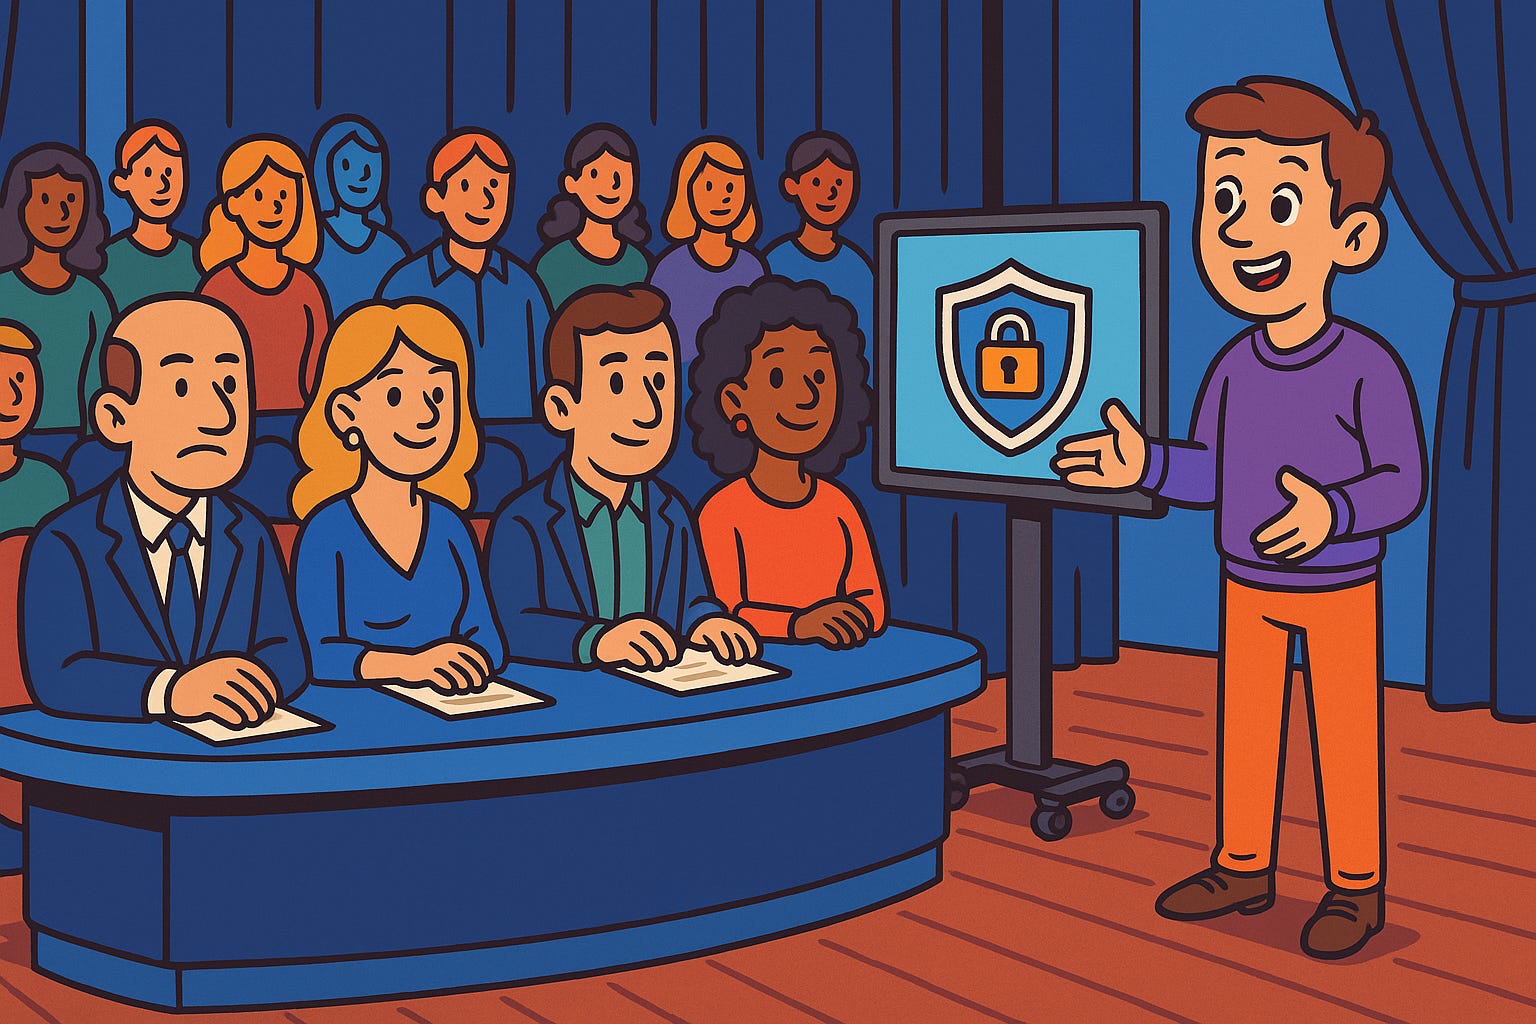
The Setup
We created an open-to-the-public event that was part Shark Tank, part American Idol: cybersecurity startups pitched to a panel of CISO judges in our arena-style auditorium. But here's where it got interesting: we set up a prediction market so attendees could "trade" on which startup they thought would win at the end of the night.
A prediction market is essentially a crowdsourced forecasting tool where participants buy and sell contracts based on event outcomes. The trading price reflects the collective probability that participants assign to each outcome. Think of it as real-time betting on future events; the more demand for a particular outcome, the higher its implied probability.
To make it more engaging and test the concept, we added other prediction questions: Will it rain tomorrow? Who will win the Giants game? What's the probability of a major data breach in healthcare this quarter?
The Key: Proper Incentives
Prediction markets work best when participants have skin in the game: something to gain or lose. We offered prizes and leaderboard clout to the best forecasters, which incentivized people to use their genuine knowledge and research rather than just guessing randomly.
The Results
The accuracy was remarkable. The market consistently predicted not just the startup pitch winners (judged at the end of the evening), but also sports games, weather patterns, traffic conditions, and short-term cyber events that we could verify within a month.
When we talked to the most accurate forecasters, I found something interesting: many were fantasy football players, poker enthusiasts, or people with backgrounds in meteorology, statistics, or microeconomics. What they had in common was probabilistic thinking: the ability to reason about uncertainty and update beliefs based on new information.
Why This Matters for CRQ
I've often thought about extending this to regular cybersecurity use cases. Imagine a public prediction market where the entire cybersecurity community collectively forecasts cyber events. Done right, this could provide base rates (or better) for our quantitative risk assessments.
The challenge? Confidentiality. Most companies can't share the detailed information needed to make such markets work effectively. It becomes a tragedy of the commons; everyone wants to use the data, but few can contribute without violating privacy or competitive concerns.
Still, the concept shows the power of structured, incentivized expert judgment. Even if we can't build industry-wide prediction markets, we can apply the same principles in our SME workshops: create the right incentives, structure the process, and tap into the collective wisdom of people who think probabilistically.
Want to Try It? Check out Good Judgment Open, a publicly accessible prediction market where you can practice forecasting on everything from politics to technology trends.
📚 What I'm Reading
Each issue, I'll share a few blog posts, research articles, or tools worth your time. Here are three standouts I've been diving into:
The Role of the Risk Sin Eater by Jack Freund: This one is a little older, but I still share it often with friends and coworkers. Jack is one of my favorite writers on risk, and in this piece he draws a sharp parallel between modern cyber risk approval practices and the centuries-old tradition of sin eaters, figures in rural Europe who symbolically absorbed the sins of the dead, urging us to abandon this outdated folklore and let business leaders own their risks.
The GRC Engineer Newsletter by Ayoub Fandi: I really enjoy the GRC Engineer newsletter by Ayoub Fandi, and this issue is one of my favorites. It offers a clear, practical framework for designing security-first controls that reduce real business risk, rather than just satisfying compliance requirements, and shows how this approach can make compliance easier and more meaningful.
Bringing Financial Discipline to Cyber-Risk Decisions by Laura Voicu: This is one of the most practical and accessible deep dives into aligning cyber risk decisions with financial rigor. Laura walks through a ransomware scenario using FAIR, NPV, IRR, and the Gordon-Loeb model to show how to move beyond ROSI and make smarter, defensible investments in security. If you're trying to speak the language of finance while making risk-informed decisions, this is a must-read.
Got recommendations? Send them my way, and I'll feature reader picks too.
🗂 From the Archives
Here are a few blog posts of mine you might enjoy:
“That Feels Too High”: A Risk Analyst's Survival Guide: This post explores why risk estimates often get challenged with comments like “that feels too high,” despite being backed by solid analysis. It outlines three common reasons for pushback: missing information, cognitive bias, and communication gaps, and offers a practical framework to diagnose and respond constructively, turning discomfort into a valuable part of the decision-making process.
Using Risk Assessment to Support Decision Making: This post reframes risk assessments as tools that support decision-making, emphasizing that without a clear decision to inform, defined by choice, preference, and information, a risk assessment often falls short. It offers a practical framework to help analysts focus their efforts, using real-world examples to show how clarifying the underlying decision can make assessments more useful and aligned with business goals.
🙋 Questions
So far in the industry, I've realized that companies still have the appetite to do cyber risk quantification (monetary terms) for a one-off event like a ransomware or a data breach. However, doing it for each and every cyber risk in their register seems difficult.
For example, I worked with an organization that had almost 1500 risks in their cyber risk register and they did it using qualitative analysis. How do you propose an org can use quantitative analysis for a big number like 1500 risks?
- From Varun W.
Great question! You've hit on one of the biggest practical barriers to adopting decision-based risk. The answer isn't to quantify all 1500 risks - it's to fundamentally rethink what belongs in a "risk register."
The problem: That 1500-item list likely contains a mix of vulnerabilities, controls, scenarios, and compliance items that aren't actually decision-relevant risks. Most organizations treat their risk register like a comprehensive inventory rather than a decision-support tool.
The solution: Start with portfolio thinking, not individual risk scoring:
Aggregate first - Group those 1500 items into major loss scenarios (ransomware, data breach, system outage, etc.). You probably have 8-12 actual business-impacting scenarios.
Quantify the scenarios that matter - Focus on the loss events that could actually influence executive decisions about budget allocation, insurance, or strategic direction.
Use the 80/20 rule - A small number of scenarios likely drive most of your actual risk exposure. Quantify those first.
The mindset shift is moving from "we have 1500 risks to manage" to "we have $X million in annual loss exposure across Y major scenarios - where should we invest to reduce it?"
Most of those 1500 items are probably controls or vulnerabilities that feed into the major scenarios, not separate risks requiring individual quantification.
What decision was that 1500-item register actually helping executives make?
✉️ Contact
Have a question about risk analysis or have a general inquiry? Here’s how to contact me:
Reach me at:
Reply to this newsletter, if you receive via email
Comment below
Connect on LinkedIn
What specific risk analysis challenges are you facing? Hit reply and let me know - your question might become the focus of a future deep dive.
❤️ How You Can Help
✅ Tell me what topics you want covered: beginner, advanced, tools, AI use, anything
✅ Forward this to a colleague who's curious about CRQ
✅ Click the ❤️ or comment if you found this useful
If someone forwarded this to you, please subscribe to get future issues.
- Tony
What a great and extremely practical writeup. The Bayesian update setup is excellent, and the tips for using publicly available baseline, such as the Cyentia IRIS publication, as prior makes this very practical.
A useful follow-on would be to complete that with a systematic methodology for marrying the prior with internal context: near misses, SIEM telemetry, threat intelligence and control architecture and efficacy etc. Then to round that off with the techniques for enriching that with SME estimates, as you suggested, in the trifecta of data sources.
I thoroughly enjoyed the systematic framing.
This has gone into my bookmarks!
Appreciate the write-up. I'm a bit confused on Use Case 3, though. Figures A1 and A2 on pg 34 or the IRIS report seems to show likelihood adjustments rather than loss adjustments. The example given for healthcare you've given as 1.19, but I see 1.34 for healthcare (1.19 is listed for Retail). Can you clarify that?