Issue 1.5 | Beyond Base Rates: Turning IRIS Data into Risk Conversations
The Missing Piece: Which Threats Actually Affect Organizations Like Yours

In This Special Issue:
📊 Incident-Specific Frequencies: Use IRIS 2025 data to move beyond overall probabilities and understand which threats actually affect organizations like yours
🎯 The Complete IRIS Formula: Layer incident types from IRIS 2025 onto your base rates for targeted threat modeling
🗣️ Conversation Transformation: New conversation unlocks that are enabled with IRIS research instead of guesswork
🏠 Your Risk Analysis "Home Lab": Practice these IRIS-based skills even if your company doesn't do quantitative risk yet
Hi!
A few weeks ago in Issue 1, we explored Bayesian thinking and showed you exactly how to extract your organization's base rates from IRIS 2025. We walked through four use cases: establishing base rates, applying sector adjustment, estimating loss magnitude using revenue-tier and sector benchmarks, and factoring in risk trajectory. You learned the methodology - how to start with what you have and get better over time.
I enjoyed working with the IRIS report so much, I wanted to do one more practical application before Issue 2 drops in early August. Think of this as a quick follow-up that builds naturally on your foundation.
Thank you for reading,
Tony
The Missing Layer in Your Risk Analysis
Where We Are: In Issue 1, you've established your organization's sector-specific base rates using IRIS 2025 data. You now have solid, research-backed probabilities for experiencing a significant cyber incident.
The Next Layer: Those base rates tell you about overall incident likelihood, but they don't help you understand which types of incidents are most likely to affect organizations like yours. That's where incident-specific frequencies come in.
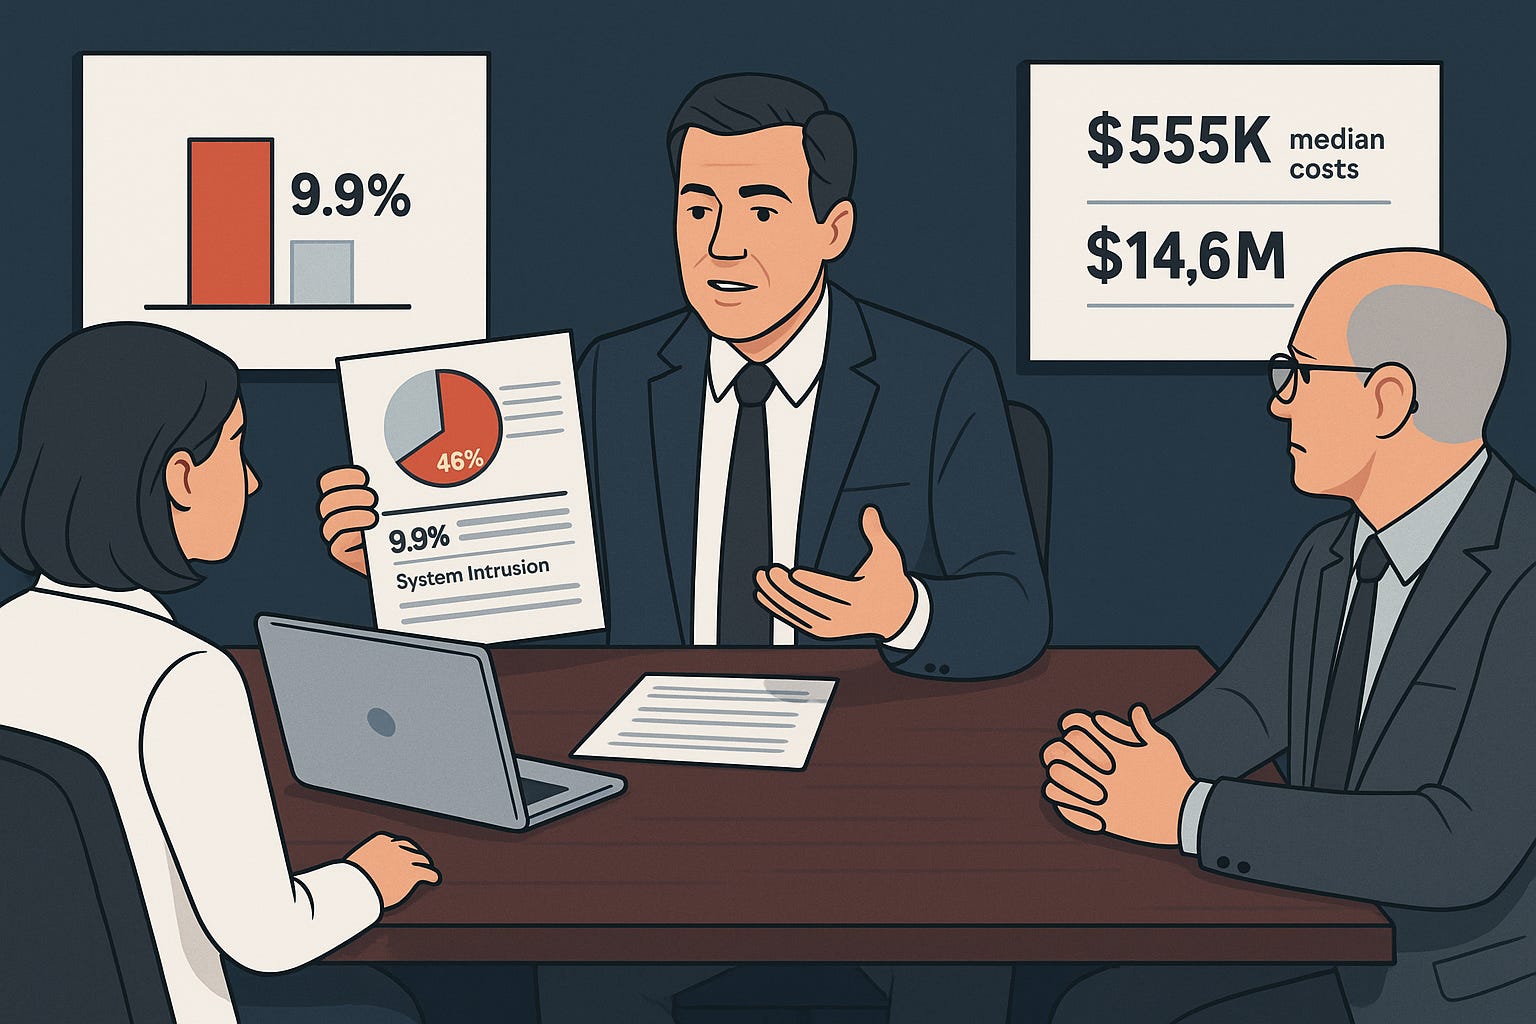
The Unlock: By layering incident-specific frequencies onto your base rates, you can move from "we have a 9.9% annual severe incident probability" to "we're most likely to face system intrusion (46% of incidents), followed by ransomware (35%), with accidental disclosure making up 3%."
This enables much more targeted conversations with leadership about where to focus security investments, what scenarios to prepare for, and how different threat types might impact your specific business operations.
IRIS 2025: Calculate Your Incident-Specific Risk
You've built your sector-specific base rates. Now let's drill one layer deeper to understand which types of incidents organizations in your sector actually experience.
The Complete Formula
Up to this point, we’ve been talking about overall incident probability. That’s useful, but it still leaves an important question unanswered. If an incident does occur, what kind of incident is it most likely to be?
This is where incident-specific frequencies come in.
At a high level, the idea is simple. You start with your organization’s overall probability of experiencing a significant cyber incident, then you decompose that probability based on the types of incidents that actually occur in the real world.
Here’s the formula we’ll use:
Incident-Specific Probability
= Base Rate × Sector Adjustment × Incident Type Percentage
Before we apply it, one clarification matters.
The incident type percentages from IRIS are conditional distributions. They describe how incidents break down given that a significant incident has occurred. They are not independent risks, and they are not additive. This formula doesn’t create new risk. It simply partitions an existing annual probability into more actionable pieces.
In other words, we’re taking one overall likelihood and asking, “If something happens, what does it most likely look like?”
Each part of the formula plays a specific role.
The base rate represents the annual probability that an organization experiences at least one significant cyber incident that enters the public record.
The sector adjustment is a relative likelihood factors drawn from IRIS. IRIS does not prescribe a single official way to combine revenue tier and sector effects, so we use the sector factor here as a transparent heuristic on top of a revenue-conditioned base rate.
The incident type percentage comes from IRIS’s observed distribution of incident types. Applied correctly, it lets us move from a single headline probability to a set of incident-specific probabilities that still sum back to the original total.
This distinction is subtle, but important. We’re not stacking risks on top of each other. We’re breaking one risk apart so it can be discussed, prioritized, and acted on.
With that foundation in place, we can walk through a concrete example.
Step 1: Get Your Base Rate
Current annual probability (base rate): approximately 8–9% (Figure 7, p. 12)
This is your starting point: the likelihood that an organization in this revenue tier experiences at least one significant incident that enters the public record.
Because Figure 7 already conditions on revenue tier, we do not apply an additional revenue adjustment in this example.
Step 2: Adjust for Your Industry
Source: Figure A1, p. 34
Apply your sector-specific multiplier:
Healthcare: 1.34x
Financial: 1.44x
Information: 1.55x
Education: 1.60x
Professional: 1.50x
Manufacturing: 1.03x
Utilities: 0.62x
Retail: 1.19x
Note: These are a few of the sectors on page 34; refer to the report for the full list)
Step 3: Apply Incident Type Frequency
So far, we’ve been talking about how often an organization might experience a significant cyber incident. That’s useful, but it still leaves a practical gap. Even when leadership accepts the overall probability, the next question is almost always the same.
“What kind of incident are we actually talking about?”
IRIS helps answer that by showing how real-world incidents break down by type.
To see this, turn to Figure 2 on Page 5 of the IRIS 2025 report. This figure shows the distribution of incident types observed in the IRIS dataset for the most recent year.
One important clarification before we go further. These percentages represent a conditional distribution. They answer the question: given that a significant cyber incident occurs, what type of incident is it most likely to be? They are not independent annual risks, and they should not be added together. Used correctly, they simply partition the total incident probability we already calculated.
Based on a visual reading of Figure 2 for 2024, the incident pattern looks roughly like this:
System intrusion: ~46%
Ransomware: ~35%
Denial-of-service attacks: ~8%
Accidental disclosure: ~3%
Insider misuse: ~2%
Defacement: ~1%
Scam or fraud: ~1%
Physical threat: ~1%
System failure: ~1%
These values are approximate and may not sum to exactly 100 percent due to rounding. That’s fine. Precision isn’t the goal here. Direction and relative weight are.
Another important label. This incident-type distribution is aggregated across the IRIS dataset. It is not sector-specific and it is not revenue-specific. Think of it as a general conditional pattern: when a significant incident happens, this is how those incidents tend to show up across organizations.
Despite that limitation, this breakdown is extremely useful. When you apply it to your organization’s overall incident probability, it allows you to move from a single abstract risk number to a short list of concrete scenarios that actually drive most of the risk.
With these incident-type frequencies in hand, we can now walk through a complete example and see how the math translates into something you can use in real conversations.
Real-World Example
Let’s walk through a concrete example to see how this works in practice.
We’ll stick with the same hypothetical organization: a healthcare company with approximately $800 million in annual revenue.
From earlier, we already have what we need to build a firm-specific starting point.
First, we estimate the overall probability of a significant cyber incident. Based on IRIS 2025 Figure 7 and a visual reading of the $100M to $1B revenue tier, the base annual probability appears to be roughly 8 to 9 percent.
Next, we apply a sector-relative adjustment. Using the Healthcare factor from Appendix 3, Figure A1, and treating it as a transparent heuristic, we arrive at a firm-specific prior of approximately 11 to 12 percent per year for at least one significant, publicly reported cyber incident.
At this stage, we stop adjusting. That 11 to 12 percent is the total probability we’re working with. Everything that follows is about breaking that single number into more useful pieces, not adding new risk on top of it.
Now we apply the incident-type distribution.
Using the incident-type percentages from IRIS Figure 2, we can decompose that overall probability into incident-specific probabilities. For simplicity, we’ll work with a midpoint estimate of 9.9 percent, recognizing that the real answer is a range.
Here’s what that looks like.
System intrusion:
9.9% × 0.46 ≈ 4.6%Ransomware:
9.9% × 0.35 ≈ 3.5%Denial-of-service attack:
9.9% × 0.08 ≈ 0.8%Accidental disclosure:
9.9% × 0.03 ≈ 0.3%Insider misuse:
9.9% × 0.02 ≈ 0.2%All other incident types combined:
Each on the order of 0.1% annually
These numbers are not independent risks. They are slices of the same overall probability. If you add them back up, you end up right where you started.
What matters isn’t the second decimal place. What matters is the shape of the risk. In this example, system intrusion and ransomware together account for more than 80 percent of the organization’s incident likelihood. Everything else trails far behind.
That single insight is often enough to change the conversation.
Instead of debating whether cyber risk is “high” or “medium,” you can now say something much more concrete. If this organization experiences a significant incident in the next year, it is far more likely to involve credential compromise or ransomware than any other category. That gives you a defensible basis for prioritizing controls, planning scenarios, and focusing leadership attention.
With the math out of the way, we can now look at what this enables in real conversations with finance, business leaders, and executives.
The Conversations This Enables
The real payoff of this approach isn’t the math. It’s the conversations it unlocks.
Once you’ve decomposed overall cyber risk into incident-specific probabilities, you stop arguing about abstractions and start talking about concrete, defensible scenarios. That shift alone changes how people engage with the analysis.
Here’s what that looks like in practice.
With Finance and the CFO
Before, the conversation often sounds like this:
“We need more security budget because cyber threats are increasing.”
After applying this approach, the conversation changes shape:
“Based on IRIS 2025 data, organizations like ours face roughly an 11 to 12 percent annual probability of a significant cyber incident that enters the public record. Over 80 percent of that likelihood is driven by system intrusion and ransomware. Those are the scenarios that dominate our risk exposure, and they’re the ones this investment is designed to reduce.”
At this stage, you don’t need to pretend you have perfect loss estimates. What matters is that you can explain where risk is concentrated and why certain investments are aimed at specific, high-probability scenarios. When finance teams see that you’re reasoning from data rather than fear, the tone of the conversation changes.
With Business Unit Leaders
Before:
“Everyone needs to be more security conscious because cyber risk is high.”
After:
“Industry research shows that when significant incidents occur, nearly half involve system intrusion, often driven by credential compromise. For organizations like ours, that translates into several percentage points of annual risk concentrated in how access is managed day to day. The practices your team controls directly influence that exposure.”
This reframing connects abstract cyber risk to operational behavior. Business leaders may not care about probability theory, but they understand cause and effect. Incident-specific frequencies give you a credible bridge between the two.
With the Board and Executives
Before:
“Cyber risk is one of our top concerns.”
After:
“Industry data suggests our overall likelihood of a significant cyber incident is on the order of ten percent annually, with most of that risk concentrated in a small number of scenarios. We’re prioritizing controls and resilience measures accordingly, and we can show how those choices change the shape of our risk profile over time.”
Notice what’s missing here. There’s no overconfident claim of precision, and no reliance on a single scary number. Instead, you’re showing that risk is being actively managed, measured, and revisited as conditions change. That’s what boards are actually looking for.
What Really Changes
In each of these conversations, something subtle but important happens. You stop defending your instincts and start explaining your analysis.
You’re no longer the person saying, “I think cyber risk is high.” You’re the person saying, “Here’s how industry data breaks down, here’s where our exposure really sits, and here’s why we’re focusing where we are.”
That shift builds credibility, not because the numbers are perfect, but because the reasoning is visible and disciplined.
🎯 Your Next Steps
Calculate your top 3 incident probabilities using this method
Multiply by potential loss estimates (see IRIS 2025 loss data by sector/revenue)
Upgrade your conversations: budgeting, insurance planning, and board presentations
Update annually as baseline probabilities and threat landscapes evolve
🏠 Homework: Pick One Conversation
Your assignment: Choose one conversation you need to have in the next two weeks where you've been struggling with credibility or budget approval.
Calculate your incident-specific probabilities using the formula above
Use the conversation frameworks to build your specific analysis
Lead with "Industry research shows..." instead of "I think..."
Watch how the conversation changes
The goal isn't perfection - it's moving from opinion to analysis.
Your Risk Analysis "Home Lab"

What if your company doesn't do quantitative risk analysis, but you still want to try these techniques?
Here's my recommendation: do this stuff at home anyway.
Other people in the security field always talk about having a "home lab" - spinning up VMs, practicing penetration testing, learning new tools. This is our version of a home lab: practicing quantitative risk analysis.
Why this matters:
Skill development: These analytical skills transfer to every risk conversation you'll ever have
Pattern recognition: The more assessments you build, the better you get at spotting what matters
Confidence building: When you do get the chance to do this professionally, you're already practiced
Career advancement: Quantitative risk skills are becoming table stakes for senior security roles
Practice scenarios to try:
Pick a company from recent breach headlines and reverse-engineer their risk profile
Model your previous employer's risk using public information
Build risk comparisons between different sectors you're curious about
Practice the conversation frameworks with industry colleagues
Think of it as professional development, not just a theoretical exercise. Every assessment you build makes you better at the next one.
🔑 Key Takeaways
For Leadership Conversations: Stop saying "we have high cyber risk." Start saying "Based on IRIS 2025 data, organizations like ours face a 4.6% chance of system intrusion and 3.5% chance of ransomware this year. These aren't generic estimates; they're based on what actually happened to similar organizations in our sector."
For Security Planning: Focus defensive investments on your top 2-3 calculated risks rather than spreading resources equally across all possible threats. In our healthcare example, system intrusion (4.6% probability) and ransomware (3.5% probability) represent over 80% of the incident risk profile.
For Budget Conversations: Use the complete formula (Base Rate (revenue-conditioned) × Sector Factor × Incident Type %) to move from opinion-based requests to real risk analysis. "Without this $200K investment, we have a 15% chance of losses exceeding $5M annually. With it, that drops to 8% chance of exceeding $2M" is a CFO conversation.
The way I framed risk above is called a loss exceedance statement. They are much stronger than heat maps because they:
Show tail risk (the really bad scenarios CFOs worry about)
Use probability language that executives understand from other business decisions
Focus on the "what if we get unlucky" scenarios that keep leadership awake at night
Mirror how insurance and financial risk is typically discussed in boardrooms
For Professional Development: Practice these calculations even if your company doesn't do quantitative risk yet. These analytical skills transfer to every risk conversation you'll ever have and are becoming table stakes for senior security roles.
What's Coming
A note on IRIS focus: I know we've spent significant time on IRIS 2025 between Issues 1 and 1.5. That's intentional. The last IRIS was published in 2022, and it's genuinely one of the most important resources a cyber risk analyst has. Getting the most value out of this research felt worth the deep dive.
But we're moving on from here. Issue 2 will shift focus to completely different things.
✉️ Contact
Have a question about this issue or risk analysis in general? Here's how to reach me:
Reply to this newsletter, if you receive via email
Comment below
Connect on LinkedIn
Had success with any of the content here? Hit reply and share your story. These become case studies for future issues.
❤️ How You Can Help
Forward this to someone who needs to upgrade their risk conversations
Click the ❤️ or comment if you found this useful
Tell me what topics you want covered next
If someone forwarded this to you, please subscribe to get future issues.
- Tony
Great article Tony! I noticed many of your frequency estimates have two significant digits, and was curious, why did you choose to do that?