Issue 3: From "We Can't Measure This" to "Good Enough to Decide"
Estimating the Real Risk of Getting Your Phone Hacked at DEF CON

In This Issue:
📖 Book Update
🎯 A Practical Introduction to Risk Measurement
📚 What I’m Reading
Hey there,
This issue is focused on one core technique, with immediate applications you can try this week, instead of several ones.
Let me know what you think of this format. I'm genuinely curious whether this hits better than the longer, packed emails.
📖 Book Update: Part 1 Complete!
A big milestone this month: Part 1 of "From Heatmaps to Histograms" is now complete and has been submitted to the publisher. Additionally, I'm more than halfway through the first drafts of the entire book. Here's what's in the can:
Part 1 covers everything, from my embarrassing "red/yellow/green" moment at a San Francisco bank (while other teams spoke in actual dollars) to why our industry inadvertently created two completely different things, both called "risk management."
The best part might be Chapter 3 on GenAI; current AI is more like Jack Sparrow (charming but needs boundaries) rather than Data from Star Trek (perfectly trustworthy) and proper AI guardrails for use in risk analysis.
Next up: Part 2 gets into the actual step-by-step techniques you need to do this work.
Timeline update: Still targeting early 2026 for publication, with pre-orders likely available in a few weeks.
Saving the best for last…
The book’s website is up! Check it out: www.heatmapstohistograms.com
🎯 A Practical Introduction to Risk Measurement

If you're learning cyber risk quantification (CRQ), you've probably heard this before: "You can't measure cyber risk. It's too uncertain, too complex, too subjective."
This mindset stops many risk professionals from even trying quantitative approaches. However, we simply need to apply concepts from metrology, the science of measurement, and techniques from decision science, as well as other relevant disciplines, to this problem.
Measurement is a core discipline utilized across various fields, including science, medicine, finance, and engineering. Astronomers calculate the mass of planets they'll never touch. Epidemiologists estimate infection risks across populations they can't fully observe. Engineers estimate failure rates for systems with millions of components. None has perfect information; all work with uncertainty ranges and probabilistic thinking.
The same techniques work for cyber risk. The goal isn't precision for its own sake; it's moving from "we know nothing" to "we know enough to make better decisions."
The Challenge: From LinkedIn Skepticism to Practical Measurement
Here’s the inspiration for this issue. I recently saw this post on LinkedIn that perfectly captures measurement skepticism:
"The advocates of quantitative risk analysis point to sophisticated math, but ultimately how do you measure the likelihood of any given adverse event? It's a judgement call. How likely is it your phone will get hacked at DEFCON? ...oh...somewhere between 0 and 100 percent depending on who you ask. The quality of the SMEs matter more than the tools they use."
Challenge accepted! Let's demonstrate core cyber risk quantification (CRQ) techniques using this real-world scenario and watch our estimate evolve from complete ignorance to actionable insight.
What Is Fermi Estimation?
Before diving into techniques, understand our core approach: Fermi estimation. Named after physicist Enrico Fermi, this involves making reasonable estimates about seemingly impossible-to-measure quantities by breaking them into smaller, more estimable parts.
Classic example: "How many piano tuners are in Chicago?"

Chicago population: ~5 million people
Average household size: 2 persons per household
Households: ~2.5 million (5M ÷ 2)
Households with pianos: ~5% (1 in 20) = 125,000
Tuning frequency: once per year = 125,000 tunings annually
Tuner productivity: ~1,000 tunings per year (50 weeks × 5 days × 8 hours ÷ 2 hours per tuning)
Result: ~125 piano tuners
In the famous Chicago piano tuner problem, each step is estimated using data, logic, and reasoning. The goal isn't precision, it's moving from "impossible to know" to "reasonable ballpark estimate" using structured reasoning. We'll apply this same approach to the phone hacking question, and the same principles are often used to measure cyber risk.
Foundation: The Measurement Mindset
If someone claims something can't be measured, recall Douglas Hubbard's Clarification Chain from "How to Measure Anything”:
If it matters, it's detectable
If it's detectable, it can be measured as a range
If it can be measured as a range, it can be quantified
Core principles for any risk measurement:
Embrace uncertainty: Every measurement has error; our job is credible ranges, not false precision
Make judgment explicit: Risk analysis makes assumptions transparent so others can challenge them
Think Bayesian: Form initial beliefs, then update systematically as evidence emerges
Starting Point: Complete Ignorance
Current estimate: 0-100% (All possibilities equally likely)
The LinkedIn post claimed "0–100%" probability: complete ignorance where all possibilities are equally likely. This flat prior isn't a prediction; it's an acknowledgment that we have no information. Every outcome from "impossible" to "certain" is treated as equally plausible.
Technique #1: Precise Scoping (Define What You're Measuring)
The Problem: Vague definitions create meaningless measurements. "Phone hacking" could mean anything.
The Technique: Start every risk assessment by precisely defining the adverse outcome you're measuring.
Application: "Phone hacking" could mean various things. For this analysis, our scope includes device-based attacks that result in unauthorized access to data or device functionality.
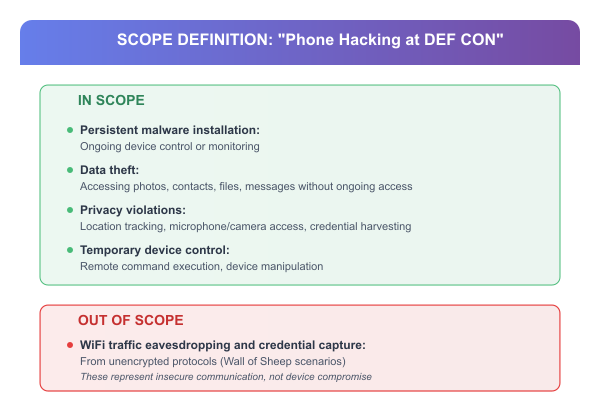
In Scope:
Persistent malware installation: Ongoing device control or monitoring
Data theft: Accessing photos, contacts, files, messages without ongoing access
Privacy violations: Location tracking, microphone/camera access, credential harvesting
Temporary device control: Remote command execution, device manipulation
Out of Scope:
WiFi traffic eavesdropping and credential capture from unencrypted protocols (Wall of Sheep scenarios). These represent insecure communication, not device compromise
Current estimate: 0-100% (Still complete uncertainty, but now we know what we're measuring)
Scoping doesn't narrow our range yet, but it's crucial foundation work. We've defined our target precisely, which prevents scope creep during analysis.
Key Principle: Always ask "probability of what, exactly?" before starting any risk measurement. Vague definitions guarantee useless results.
Technique #2: Eliminate Absurd Extremes
The Problem: Starting with "0-100%" is saying “we know knowing!” and provides no decision value. But, we do know something, don’t we?
The Technique: Use logical reasoning and available evidence to systematically rule out impossible or highly implausible values before detailed calculation.
Test the extremes systematically:
100%: If every phone among ~30,000 attendees got compromised, it would be international headlines and kill the conference. People go to jail. No hotel or convention center would dare to host it. Clearly absurd.
75-90%: 22,500+ device compromises would be the biggest cybersecurity story of the decade. Still absurd.
50%: 15,000 victims would generate a massive industry response and likely lead to changes or the cancellation of the conference. Extremely unlikely.
25%: 7,500 compromised devices would create an unprecedented security industry crisis. Very unlikely, but starting to enter the realm of possibility.
10%: 3,000 incidents would still generate major headlines and community outcry. Possible, but would be widely reported.
5%: 1,500 compromises would generate some industry discussion. Getting into plausible territory.
On the other end of the range:
0%: DEF CON represents a unique high-threat environment with demonstrated attacks. Not zero risk.
Updated estimate: 0.5-5% (90% confidence interval)
Confidence change: We've eliminated 90% of the original possibility space using pure logic. This is the power of logical thinking: most of human intuition about "impossible" vs "possible" is actually quite good.
Key Principle: Start every risk estimate by ruling out the obviously absurd answers. This technique applies to any uncertain scenario, from data breach likelihood to business continuity risks.
Technique #3: Threat Modeling with Attack Vectors
The Problem: "Phone hacking" is still too vague to estimate precisely. We need specific pathways.
The Technique: Enumerate concrete attack vectors, then estimate each separately.
Credible attack vectors at DEF CON:
Cellular interception (IMSI catchers): Rogue cell towers demonstrated at conferences
Malicious WiFi networks: Rogue WiFi at DEF CON
Physical attacks (BadUSB): Modified charging cables demonstrated at DEF CON 27
Social engineering: Malicious QR codes, fake apps, manipulation tactics
Zero-day exploits: Premium mobile exploits worth $15-20 million
Bluetooth exploits: Proximity-based attacks
Current estimate: 0.5-5% (Range unchanged but confidence increased)
Threat modeling doesn't narrow our range much, but it significantly increases our confidence by grounding the analysis in concrete attack scenarios rather than vague "hacking" concepts.
Key Principle: Always decompose vague risks into specific attack scenarios. "Data breach" becomes "phishing → credential compromise," "malware → lateral movement," etc. This makes the seemingly immeasurable measurable.
Technique #4: Pipeline Analysis (Fermi Decomposition)
The Problem: Complex events seem impossible to estimate because so many things must align.
The Technique: Model the event as a pipeline where multiple stages must all succeed, then multiply the conditional probabilities.
Pipeline stages for device compromise:
Stage 1: Sophisticated Attacker Presence (60-80%)
Question: Are sophisticated attackers actively targeting mobile devices with premium tools?
Key insight: DEF CON isn't random people. It's an exceptional concentration of high-value targets:
Fortune 500 CISOs and security executives
Government cybersecurity officials
Security researchers with unreleased intelligence
Critical infrastructure employees
Economic reality: A $15-20 million zero-day investment could yield intelligence worth hundreds of millions from the right targets.
Stage 2: User Vulnerability Exposure (20-40%)
Question: Do targets engage in risky behavior when attacks are active?
Even security-conscious professionals take some risks over a 4-day conference exposure: experimental culture, social pressure to participate, and inevitable human errors.
Stage 3: Technical Attack Success (2-8%)
Question: Do attacks overcome modern mobile defenses?
Our broader scope includes temporary access and data theft (easier than persistent compromise). But modern mobile security is substantial, and time constraints limit attackers.
Pipeline calculations (Fermi estimates):
Conservative: 60% × 20% × 2% = 0.24%
Moderate: 70% × 30% × 5% = 1.05%
Aggressive: 80% × 40% × 8% = 2.56%
These represent my Fermi estimates for each stage based on available evidence and structured reasoning about DEF CON's unique environment.
Updated estimate: 0.24-2.6% (Major narrowing through decomposition)
Confidence change: Pipeline analysis dramatically narrows our range by breaking an impossibly complex question into three estimable components. This is where structured reasoning really shows its power.
Key Principle: Use pipeline analysis whenever measuring complex events that require multiple conditions. Supply chain attacks, insider threats, ransomware incidents all benefit from this decomposition approach.
Technique #5: Detection Bias Analysis (Reality Check)
The Problem: My pipeline analysis assumed successful attacks would be detected and reported, but sophisticated mobile compromises are designed to be undetectable. It was at this stage that I realized the upper bound of the estimates so far did not account for this, and I need to correct this. I need to raise the upper bound slightly.
The "Dark Figure" Challenge:
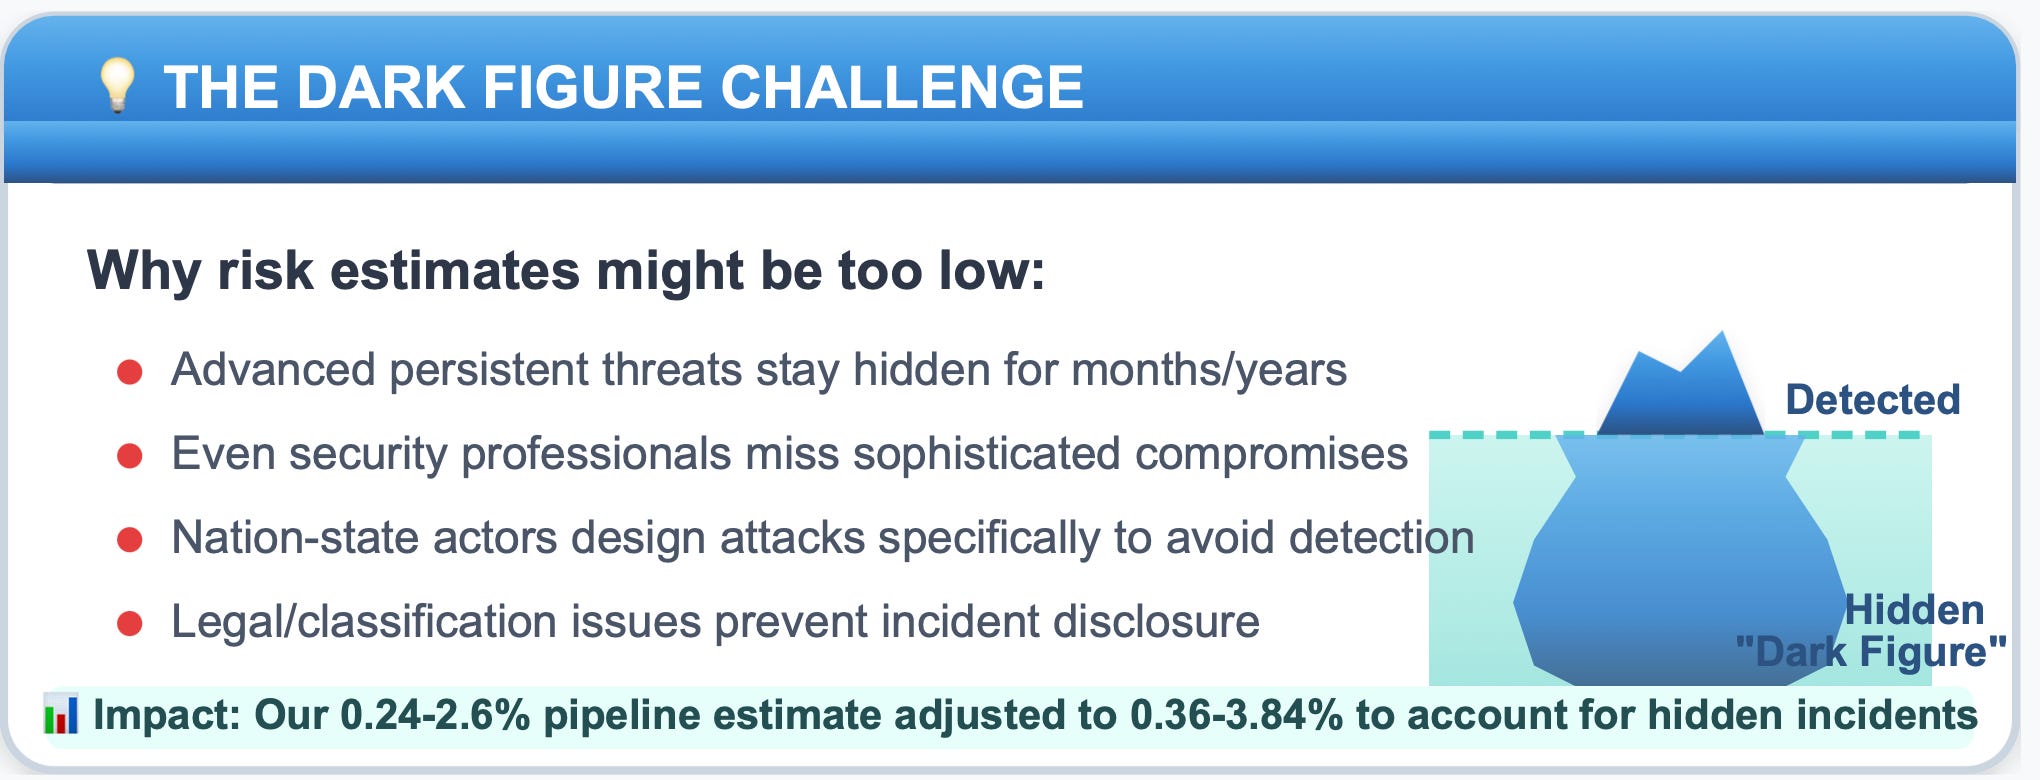
Advanced persistent threats remain hidden for months/years
Even security professionals may not detect sophisticated compromises quickly
Nation-state actors specifically design stealth attacks
Why the upper bound increases: Pipeline analysis gave us estimates based on detected incidents only. But sophisticated mobile compromises are specifically designed to avoid detection. Detection bias analysis asks: "What if many successful attacks remain completely hidden?"
The logic:
Pipeline analysis: "Based on visible evidence, attacks succeed 2.6% of the time"
Detection bias: "But what if we're only seeing 70% of successful attacks? Then the true rate could be 2.6% ÷ 0.7 = 3.7%"
Why this is methodologically sound: We're not changing our assessment of attack mechanics (pipeline stages remain the same). We're adjusting for measurement limitations - the possibility that our "no widespread reports" evidence reflects successful concealment rather than low attack rates.
Detection bias adjustment: Apply a modest multiplier for undetected incidents while respecting bounds analysis:
Conservative: 0.24% × 1.5 = 0.36%
Moderate: 1.05% × 2 = 2.1%
Aggressive: 2.56% × 1.5 = 3.84%
My analytical assessment of how detection limitations affect our estimates, constrained by earlier bounds analysis, suggests that anything approaching 5%+ would generate a visible community response.
Updated estimate: 0.36-3.84% (Upper bound increases due to measurement limitations)
Key Principle: Sometimes ranges should widen when you realize your measurement approach has limitations. Detection bias is a reality check that says "our estimates could be too low if attacks are more stealthy than we assumed."
Always consider whether your risk measurement depends on incident detection and reporting. Many cyber risks suffer from significant underreporting bias.
Technique #6: Conditional Risk Modeling (Behavior Matters)
The Problem: Treating all attendees identically ignores the biggest risk factor, individual behavior.
The Technique: Create distinct risk profiles based on key behavioral variables, while respecting the logical bounds established earlier.
Risk profiles with detection bias included (capped at bounds analysis limits):
Cautious Attendee: 2G disabled, burner phone, minimal connectivity
My estimate: 0.1-1%
Curious Attendee: Standard security practices, some experimental behavior
My estimate: 1-3%
Reckless Attendee: Primary device, connects freely, ignores warnings
My estimate: 3-5%
Current estimate: 0.1-5% depending on behavior (Maintains logical consistency with our bounds)
Why this makes sense: I can't simultaneously claim that 5%+ would generate visible community discussion (bounds analysis) and some attendees face higher risk without contradicting my own reasoning.
Key Principle: Always identify the key behavioral or environmental variables that drive risk differences. Create distinct profiles while respecting constraints from earlier analysis.
Technique #7: Bayesian Updating (Evidence Integration)
The Technique: Treat risk estimates as living hypotheses that update systematically based on new data.
Evidence assessment:
Limited public reports: Could indicate either low rates or successful stealth
Modern mobile security: Continues to improve, but is countered by sophisticated adversaries
DEF CON's unique environment: Justifies higher estimates than normal mobile security statistics
Bayesian update: Current evidence supports the moderate end of our range.
Current estimate: 0.5-4% for typical attendees (Evidence-weighted)
Critical Reality Check: The Empirical Evidence Problem
Our systematic analysis suggests meaningful device compromise rates, but there's a glaring empirical problem: the security community isn't talking about widespread device compromises at DEF CON.
The 5-year silence problem: If even our lower estimates were accurate, we'd expect some community discussion among security professionals who actively share threat intelligence and study these exact threats.
Why the silence doesn't necessarily invalidate our estimates:
Detection bias is even more severe than we thought: Truly sophisticated nation-state attacks remain completely hidden even from security professionals. Modern mobile APTs are designed for multi-year persistence without detection.
Incidents occur but aren't discussed openly: Classification concerns, legal issues, or professional embarrassment prevent sharing. Government officials and corporate executives might be specifically instructed not to disclose incidents.
Honest final assessment: 0.1-4% with low confidence
Lower bound (0.1%): ~30 incidents annually - explains the community silence
Upper bound (4%): ~1,200 incidents annually - possible if detection bias and non-disclosure are severe
Low confidence: The wide range reflects fundamental uncertainty
Final Estimate Progression Summary
Here's how our estimate evolved through systematic analysis:
Key Takeaways: The Realistic Middle Ground
It's not an urban myth, but it's also not inevitable.
Device compromise CAN happen at DEF CON - We have credible attack vectors, high-value targets, and sophisticated adversaries. The analysis suggests 0.1-4% individual risk, which is meaningfully above zero.
Historical attacks were mostly legacy exploits - The famous demonstrations involved 2G/3G cellular vulnerabilities that modern devices can now disable. Many classic attack vectors have been significantly hardened.
Wall of Sheep creates false perceptions - Hundreds of credential captures annually at the Wall of Sheep represent WiFi eavesdropping, not device compromise. People conflate seeing "lots of hacking" with device takeover, but these are fundamentally different threats.
The "100% probability" claim is nonsense - Our systematic analysis moved from 0-100% (useless) to 0.1-4% (actionable). Even in a worst-case scenario, most attendees' devices remain uncompromised.
Detection bias could explain the silence - The security community's lack of discussion about widespread device compromises over the last 5 years suggests either: (a) actual rates are toward the lower end of our range, or (b) truly sophisticated attacks remain completely hidden.
Behavior matters enormously - Cautious attendees (burner phones, disabled connectivity) face much lower risk than those who connect freely to conference networks and experimental services.
The bottom line: DEF CON device compromise is a real but relatively rare risk that's often confused with much more common eavesdropping on unsecured connections. It's worth taking basic precautions, but not worth avoiding the conference entirely.
For risk professionals: This demonstrates how structured reasoning can cut through both "it's impossible to measure" and "it definitely happens to everyone" extremes to reach a nuanced, evidence-based middle ground.
Techniques You Can Apply Tomorrow
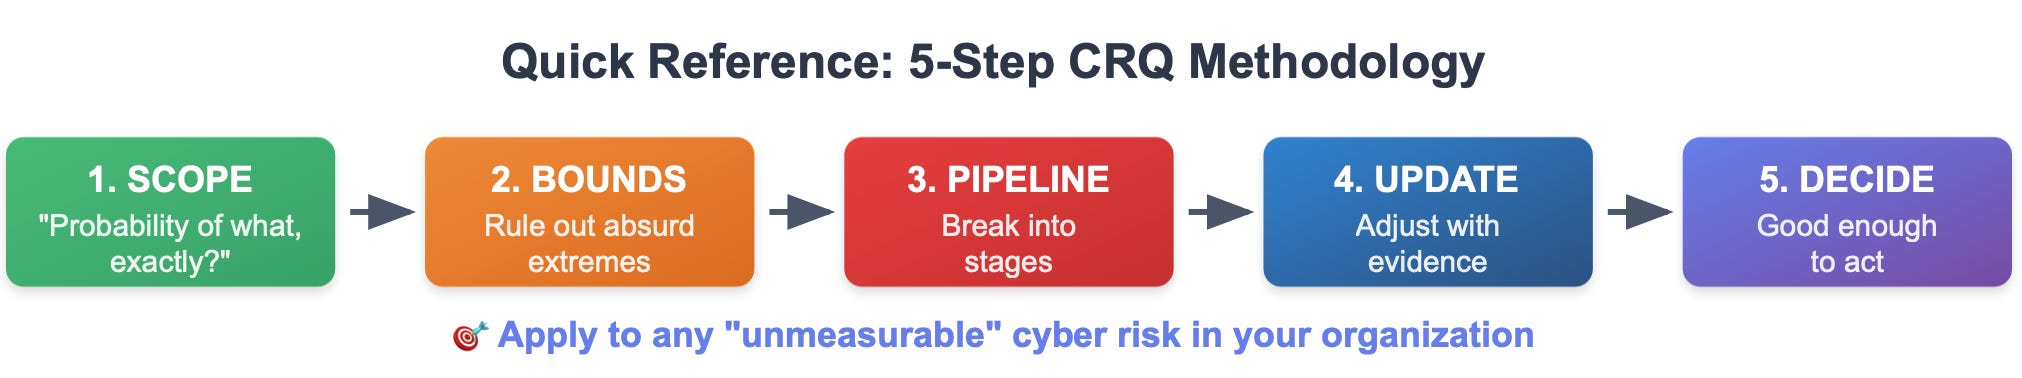
For any "unmeasurable" cyber risk scenario:
Start with bounds: Before any analysis, rule out absurd extremes using basic logic
Define scope precisely: "Data breach" isn't specific enough. Breach of what, leading to what outcome?
Use pipeline decomposition: Break complex events into stages (Attacker → Access → Impact)
Make it conditional: Different behaviors/controls should yield different risk estimates
Account for detection bias: Consider what you might not be seeing
Update with evidence: Treat estimates as hypotheses that improve with new data
Reality check: When estimates seem implausible in absolute terms, acknowledge uncertainty
Maintain logical consistency: Each step should respect constraints from previous analysis
Key insight for your organization: Even rough estimates are better than "we can't measure it." The goal isn't perfect precision. It's moving from complete ignorance to informed decision-making.
When stakeholders claim cyber risk "can't be measured": Show them this progression. We went from 0-100% (useless) to 0.1-4% (actionable) using techniques any risk professional can learn.
Do You Think I’m Wrong?
Great! Create your own analysis and estimations and share them with me.
📚 What I’m Reading
Vibe Coding and Basyesian Thought Experiment by Rick Howard
I love Rick Howard’s First Principles newsletter. I linked to one of his posts in my last issue, and I keep coming back to his writing. This latest piece brings Bayes’ classic billiards thought experiment to life with vibe coding, showing why Bayesian thinking is so powerful for risk forecasting. I constantly reference and use this approach in my own work and highly recommend subscribing.Scheer Memos - by Alexander Scheer
I just connected with the author of Scheer Memos on LinkedIn and I am glad I did. I have been really enjoying his blog; thoughtful takes on tech and cybersecurity with a mix of experience and perspective that feels fresh. I recommend subscribing if you want smart writing that makes you think.Curious About GRC? Here’s How I Got Started - by Nikita Gupta
Have you ever wondered how people actually get started in GRC, or if you have been asked that question yourself, this post is an honest take. Nikita Gupta shares her journey from “no clue what GRC was” to a thriving career, with practical steps anyone can follow. It is approachable, encouraging, and a great share for students, career changers, or even seasoned pros looking to mentor the next wave.Presilience by Dr. Gavriel Schneider
I just finished Presilience and found it eye-opening. The mix of personal stories makes the lessons real, and the practical advice is something I have already started using. Dr. Gavriel Schneider blends resilience tools with proactive risk management and leadership insights, showing how to turn uncertainty into growth. It is thoughtful, thorough, and very thought-provoking.
✉️ Contact
Have a question about this, or anything else? Here's how to reach me:
Reply to this newsletter if reading via email
Comment below
Connect with me on LinkedIn
❤️ How You Can Help
✅ Share your estimation and measurement stories in comments
✅ Forward this to a colleague who's stuck in analysis paralysis
✅ Click the ❤️ if this helped you measure the seemingly immeasurable
Thanks for reading, and remember: anything that matters can be measured.
—Tony
Thank you Tony for this awesome newsletter that describes your suggested approach.
In Issue 1 you mentioned the three-source framework based on External data , Internal data, and Subject matter expert (SME) inputs, which is a very nice way to categorise the information to collect. I was wondering how these categories map onto the 5-step methodology.
I would say that:
- External data supports step 1 (risk scenario definition) and step 2 to provide the initial estimates
- Internal data supports step 3
- SME data is more about step 4 (Bayesian)
Is this correct?
Thanks