
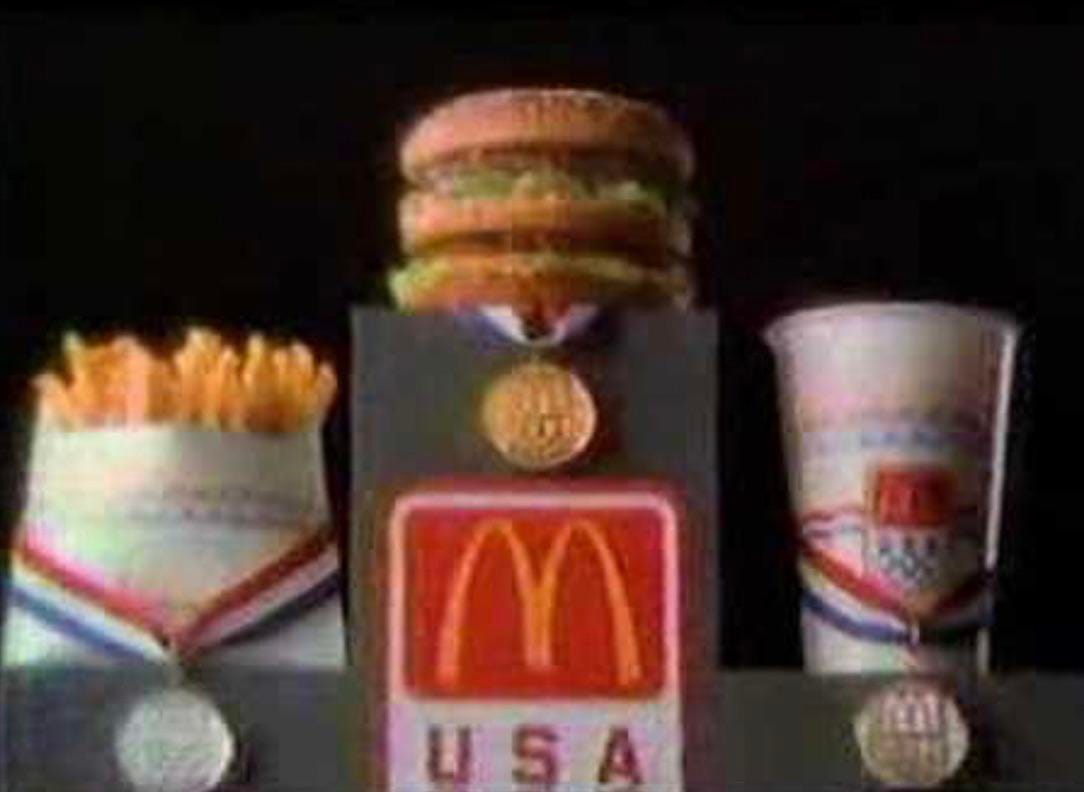
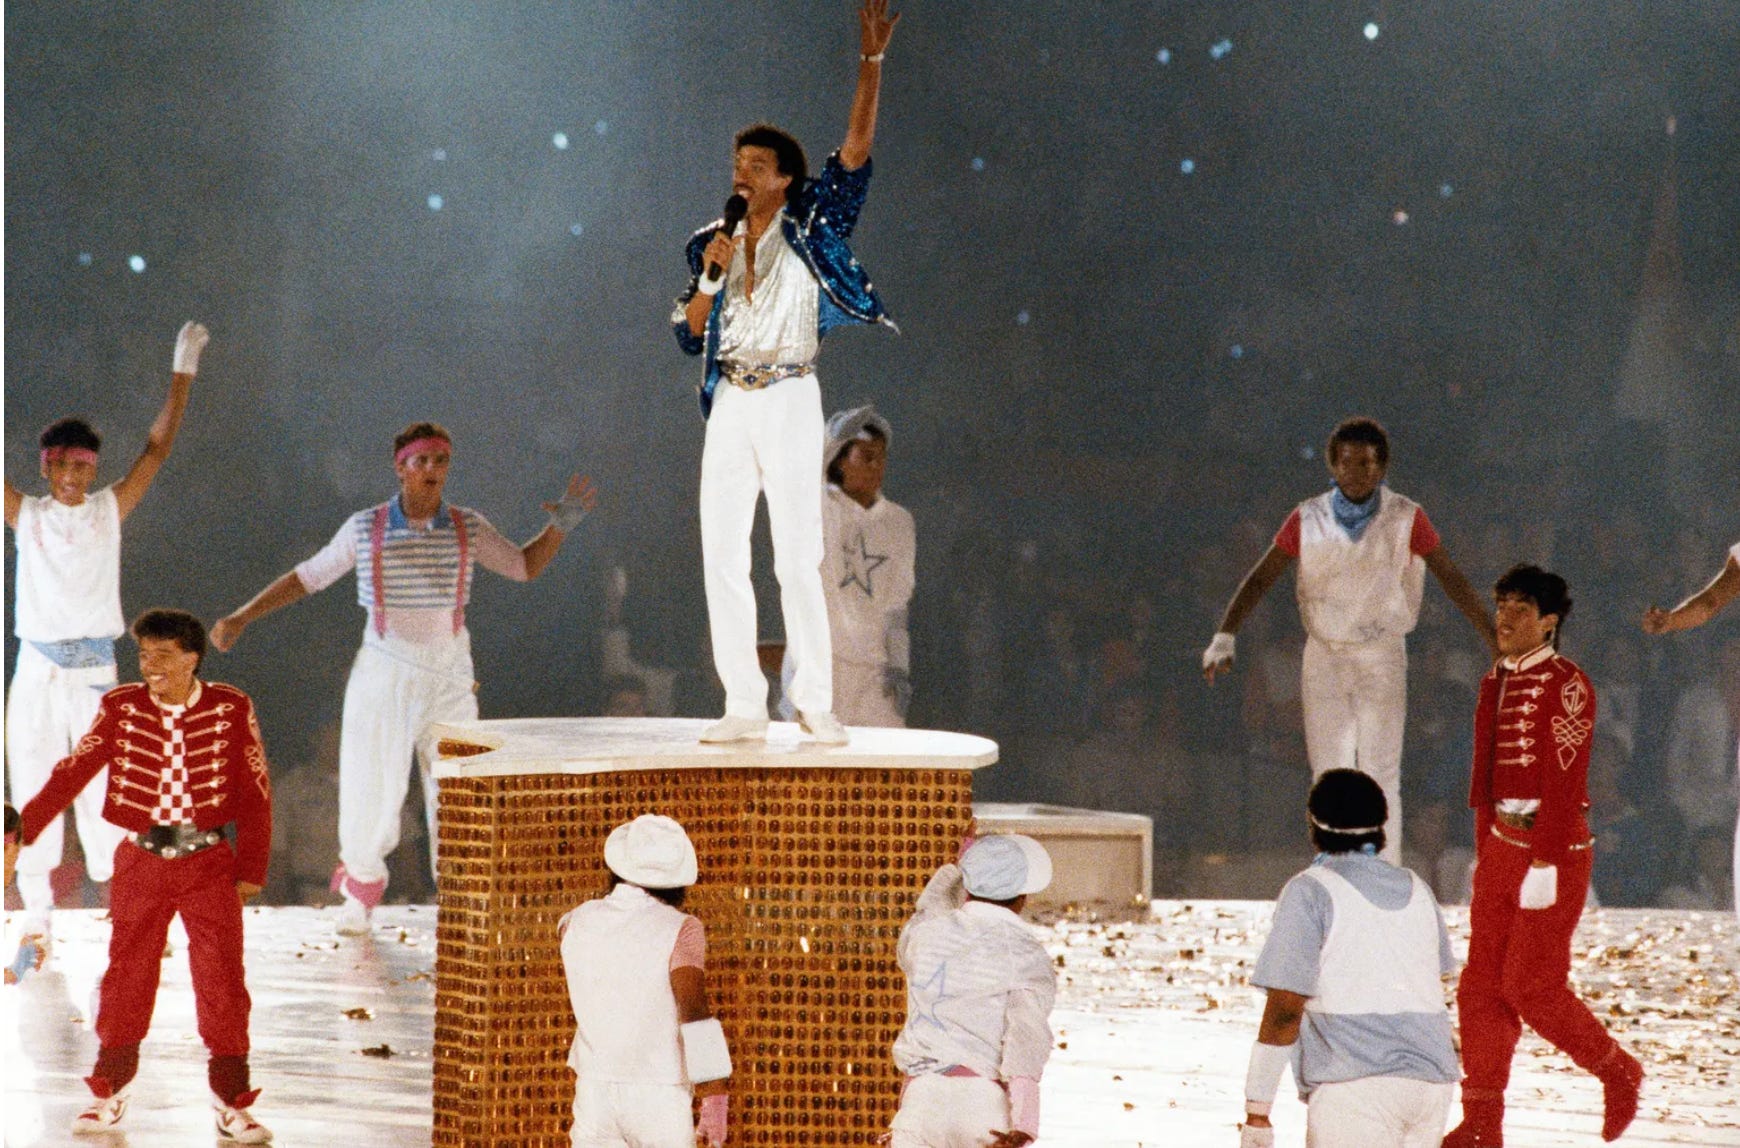
I grew up in the Los Angeles area, and even though I was a little kid, I clearly remember the 1984 Olympics. It was the biggest sports event of the early ‘80s, and every kid I knew was glued to the TV, watching the exploits of American heroes we still remember today: track and field star Carl Lewis, gymnast Mary Lou Retton, and of course, diver Greg Louganis. Who could forget Lionel Richie at the closing ceremony, singing “All Night Long” surrounded by hundreds of breakdancers? That was all we talked about when we went back to school.
The most memorable moment for me, however, was the special McDonald’s Olympics promotion, because I personally got a few Big Macs and orders of fries out of it. Decades later, the risk analyst and measurement nerd in me sees this memory as a cautionary tale about business forecasting and how to use historical data properly.
“When the U.S. Wins, You Win”
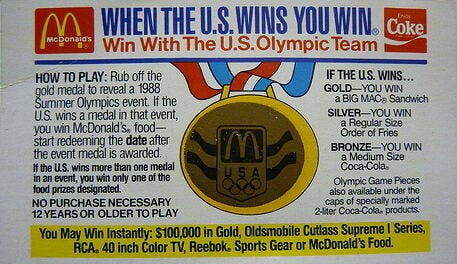
McDonald’s advertised the promotion heavily with the catchphrase “When the U.S. Wins, You Win.” Every time you bought something, you got a scratch-off card with an Olympic event on it, and if the Americans won a medal in that event, you could bring the card back in for free food. According to a New York Times article from August 1984, a gold medal got you a Big Mac, a silver got you French fries, and a bronze got you a Coke. So, when Greg Louganis won gold in platform diving, anyone holding a platform diving card walked out with a free Big Mac.
There was just one problem. On May 8, 1984, about 11 weeks before the Games opened and with the promotion already in the works, the Soviet Union announced it wouldn’t be coming to Los Angeles. It looked a lot like a response to 1980, when the United States led a boycott of the Moscow Olympics to protest the Soviet invasion of Afghanistan. More than a dozen Soviet allies followed Moscow’s lead.
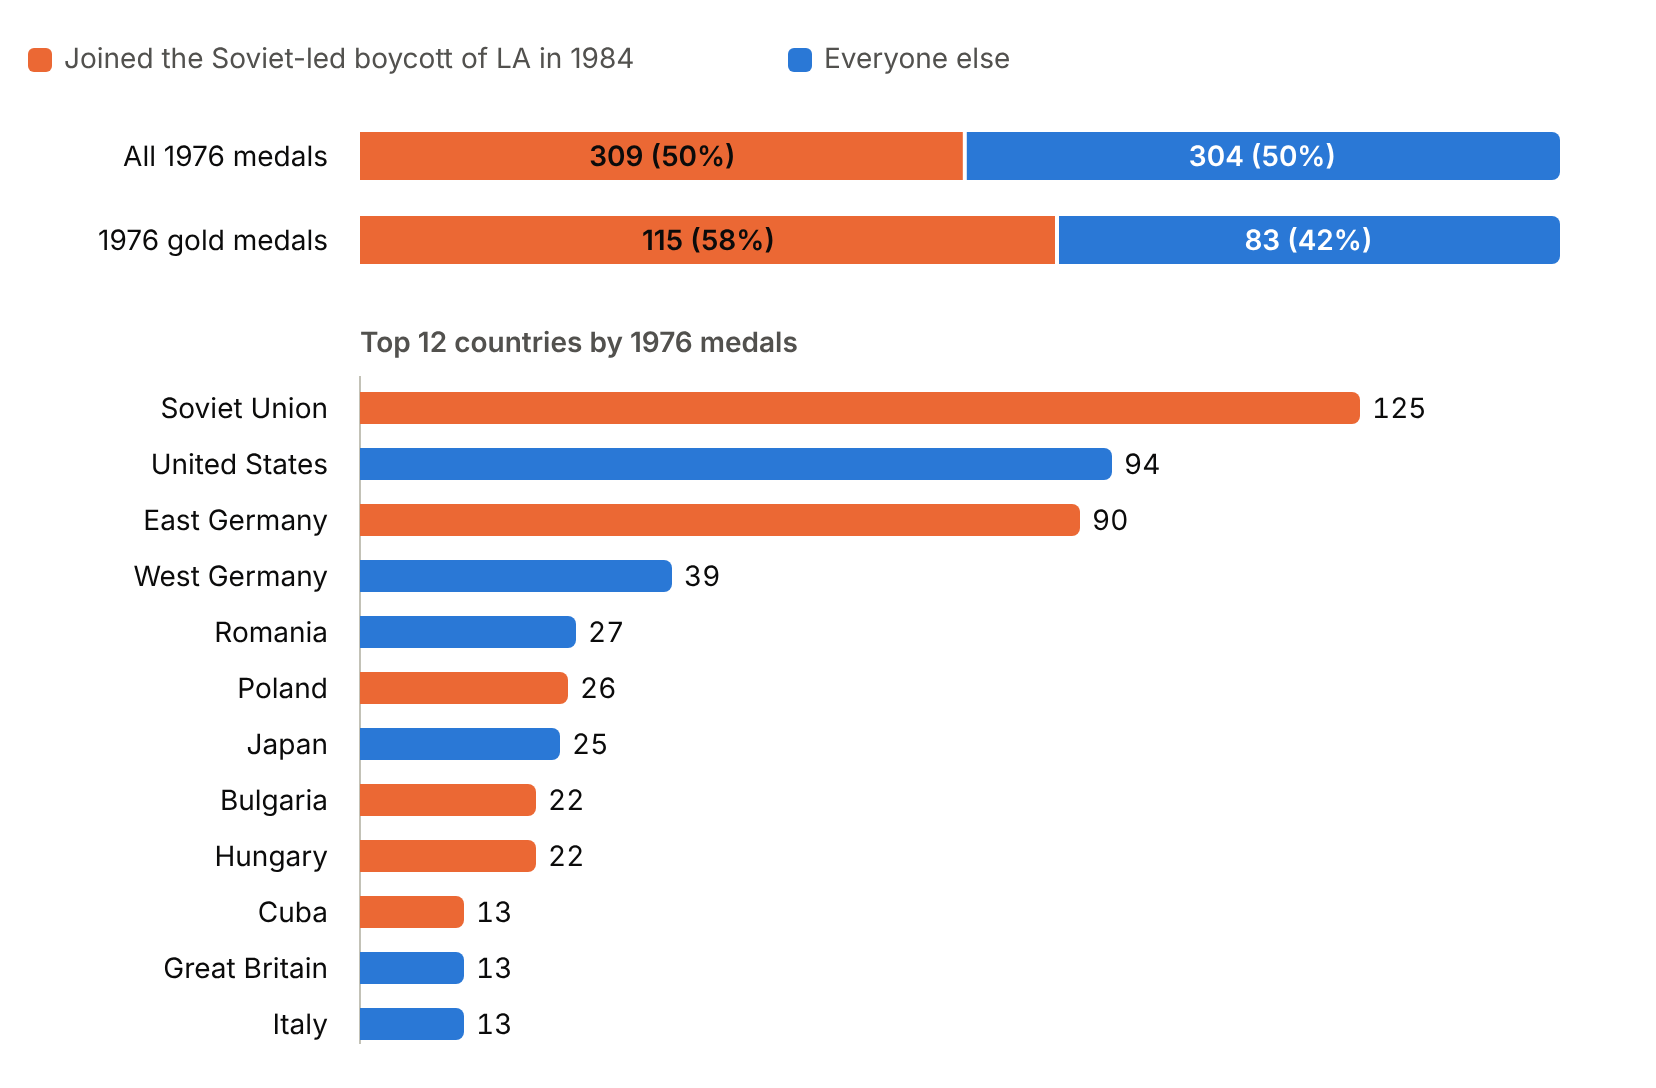
That was great news for the U.S. medal count (and my Big Mac habit), but terrible news for the McDonald’s promotion. In Montreal in 1976, the Soviet Union and the allies that joined its boycott had won 309 of the 613 medals and 115 of the 198 golds, and the U.S. had finished third in golds, behind the Soviet Union and East Germany. In Los Angeles, the U.S. won a whopping 174 medals, 83 of them gold, up from 94 and 34 in Montreal. Los Angeles also had 221 events to Montreal’s 198, so there were more medals up for grabs.
That same Times article said some of McDonald’s 6,600 U.S. restaurants had reportedly run short of Big Macs because of the unexpected surge in U.S. medal wins. The company never disclosed what the promotion cost. Its director of media relations told the Michigan Daily it had “succeeded beyond our expectations,” and the company said the extra customer traffic “more than makes up for the prizes.” I’m sure there were some angry customers anyway, like the people who watched Mary Lou Retton win gold and went in to cash in yet another Big Mac card while the U.S. was dominating the medal table, only to find their local McDonald’s sold out.
The forecast gone awry
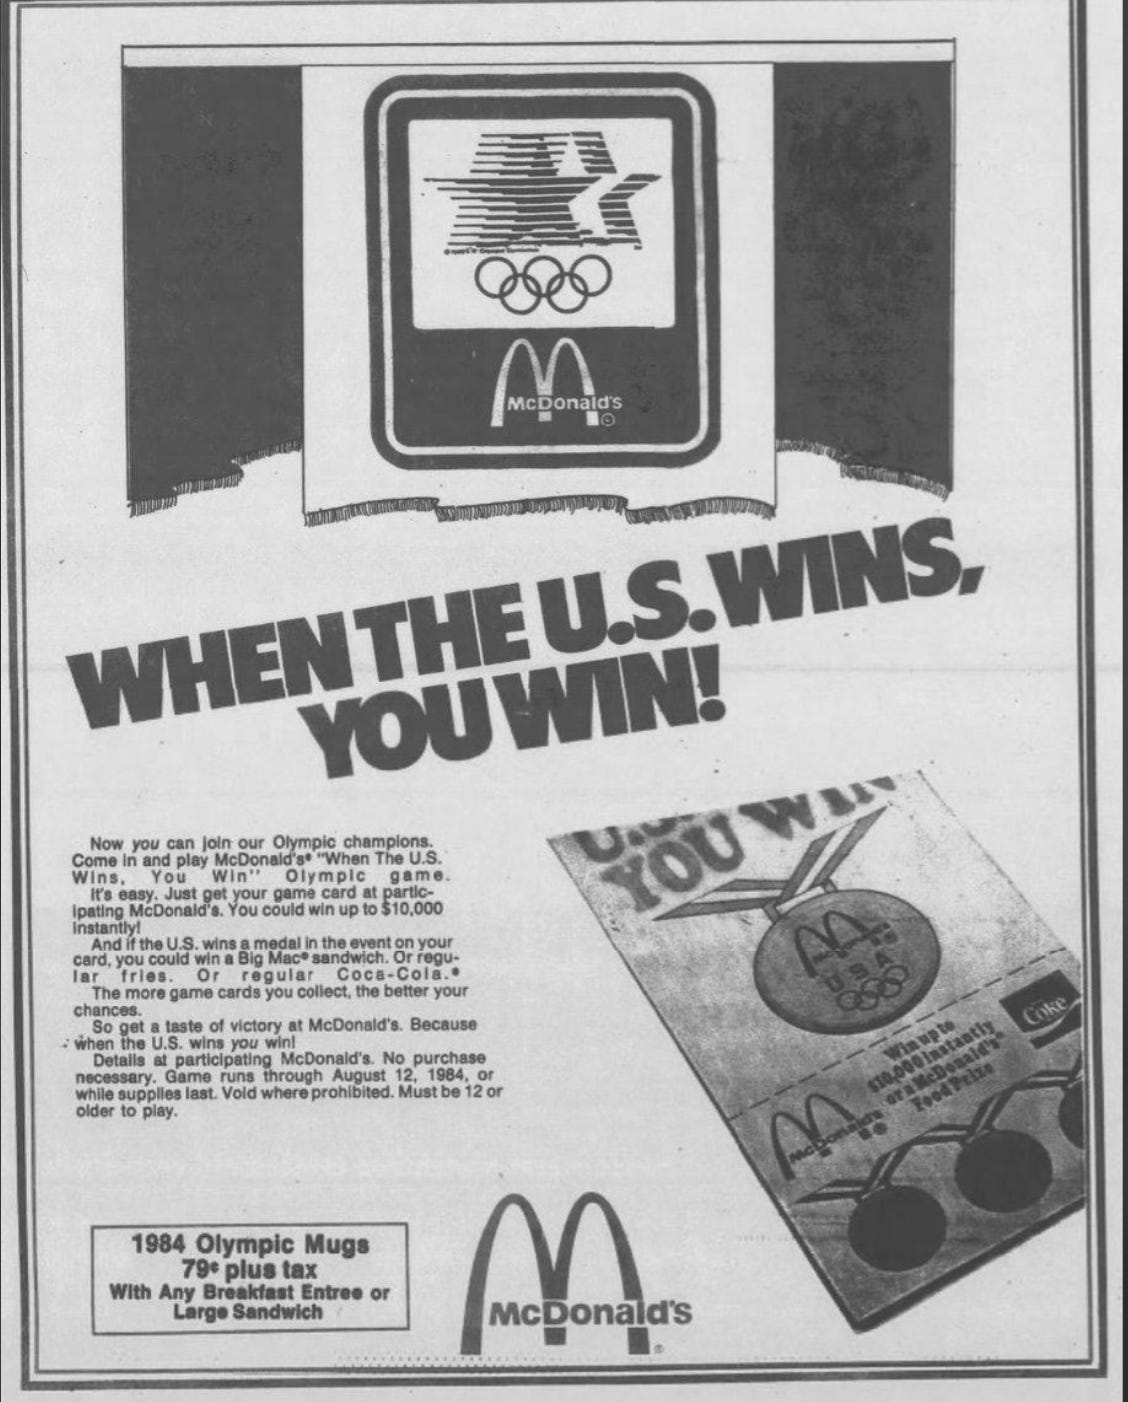
A company running a contest like this usually has a small team that forecasts what it will cost. It’s not unlike the expected value or expected loss calculations most of us in risk are familiar with. In McDonald’s case, the company had to estimate how many medals the US would win, broken down by gold, silver, and bronze, since each one turned into a Big Mac, fries, or Coke. Using that data, forecasters could estimate what the promotion would cost and whether they should move forward with the idea.
The forecast went wrong because McDonald’s based it on a single observation: the last Summer Games the US participated in, Montreal 1976.
Past events are a good but not perfect guide to what could happen next, but the past is still one of the best places to start. U.S. medal totals barely moved from 1964 through 1976 (90, 107, 94, and 94), so looking further back would have left McDonald’s average about where it was. It also would have shown them how much the Games themselves could swing. Three of the last five Summer Games had boycotts (1964, 1976, and 1980), and 1980 was the mirror image of 1984, with the Soviets hosting without the U.S. and jumping from 125 medals to 195.
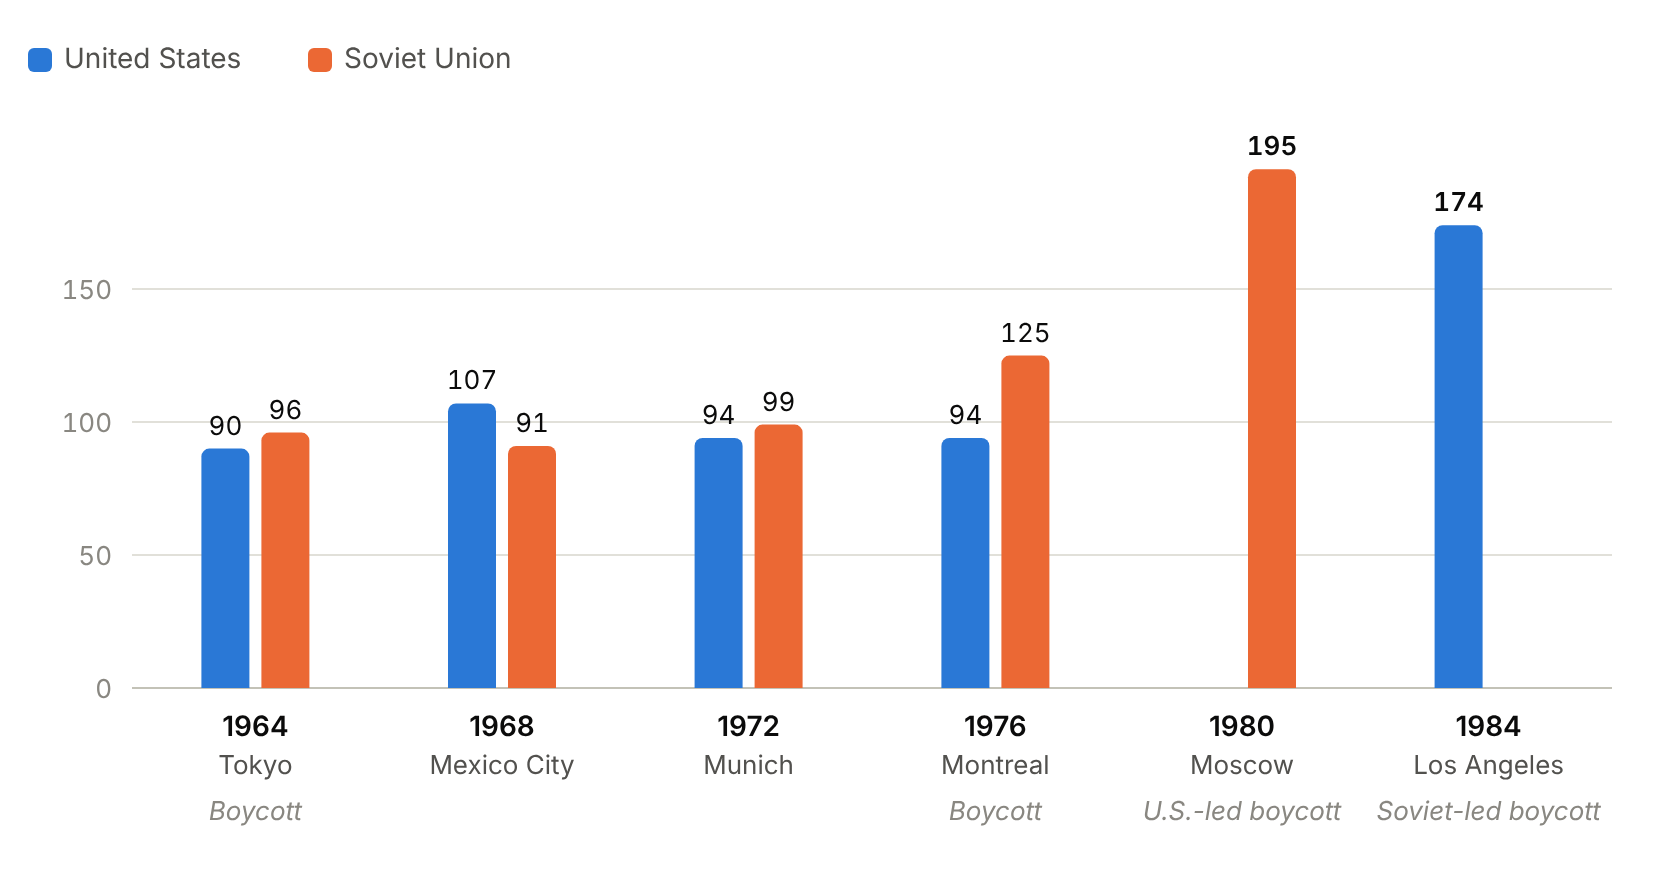
Add the geopolitics of the time, with the Cold War heating back up after the Soviet invasion of Afghanistan and a “Ban the Soviets” campaign that started in the U.S. after the Soviets shot down Korean Air Lines Flight 007 in September 1983, and a Soviet no-show should have been one of the first scenarios on the table. Basing the medal count on 1976 alone, the last Summer Games where the U.S. and the Soviet Union had competed against each other, built a single scenario into the forecast, a Games with the Soviets in it.
The modern cyber version
The McDonald’s promotion reminds me of a mistake I see in risk departments fairly often. Someone is trying to forecast a future cyber incident, and they take one incident, one loss figure, or one audit finding and use it as the basis for their whole estimate. I’ve seen both beginner and seasoned risk analysts make this mistake, especially when historical data is spotty or hard to find.
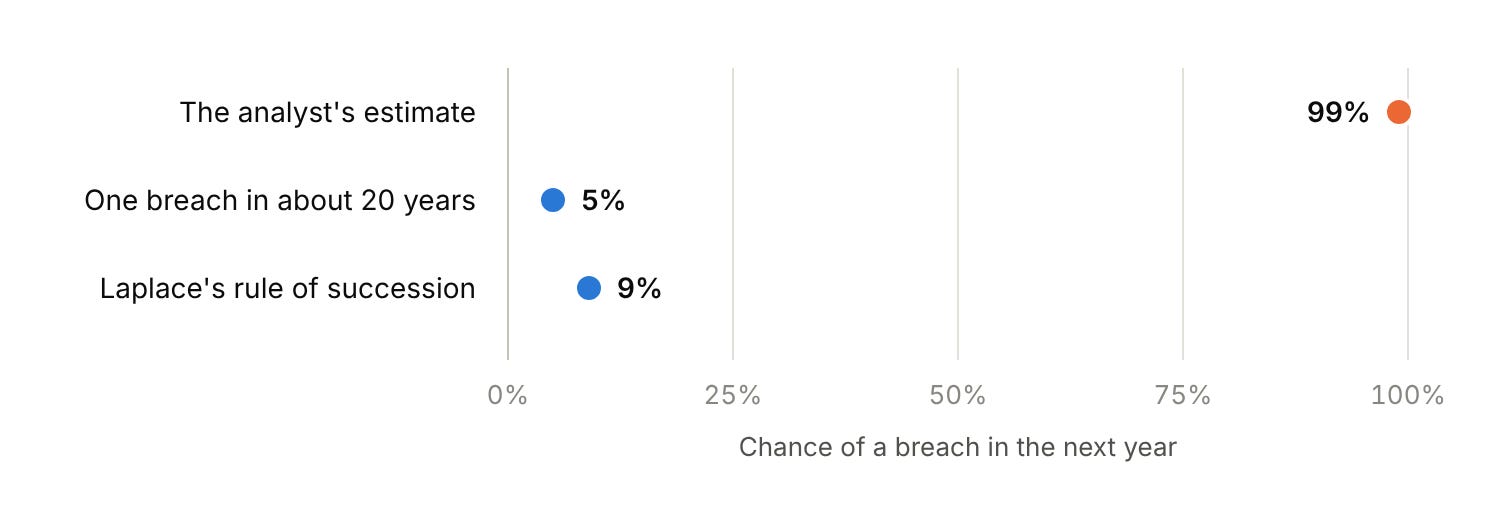
I was once working with a very good, seasoned risk analyst to estimate the probability of a data breach in the next year, and he said it was 99% because we’d had a breach the year before. That ignored nearly two decades of data with no known breaches, not to mention the major control improvements and mitigation investments the company had made in that time.
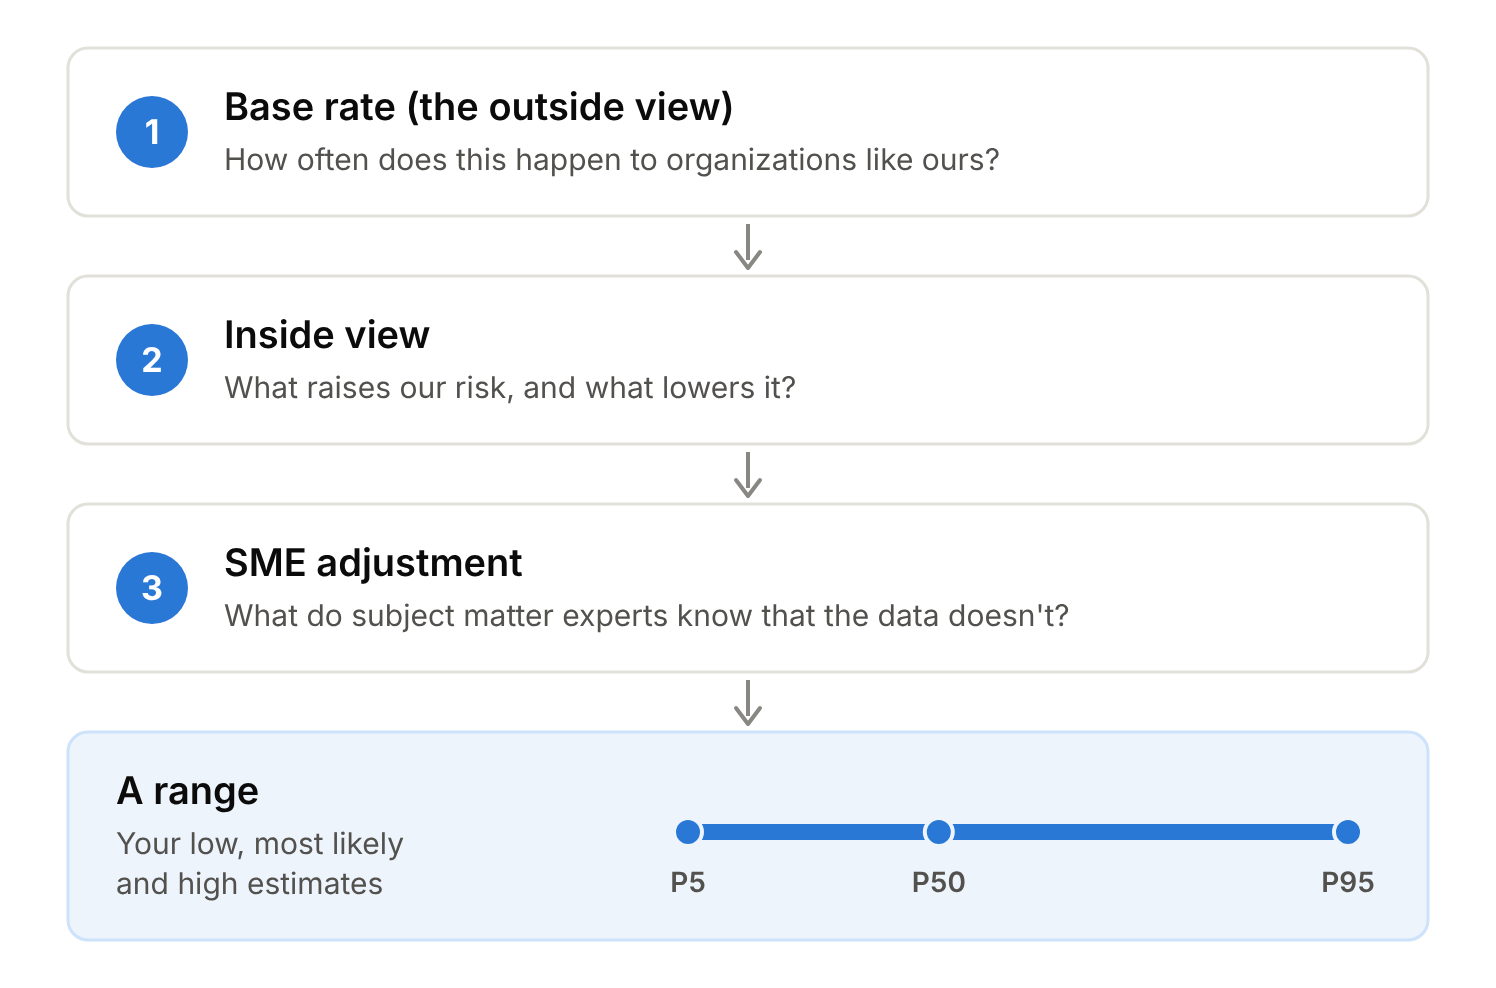
I wanted to help him correct this, so we built a range together, starting with what I always do: getting an industry base rate, which is publicly available information about how often data breaches happen in our sector. Daniel Kahneman called this taking the outside view. From there, we looked at our own environment, considering last year’s breach and bringing in organization-specific factors, like the state of our controls and unplanned risk mitigation activities.
Let me give you a spoiler. The range we came up with was nowhere near 99%. A 99% probability basically means a breach in the next year is almost certain, and nothing we found led us to believe that. Even our own history argued against it, since one breach in about 20 years works out to roughly 5% a year, or about 9% with Laplace’s rule of succession.
Why we fall for it
It’s very easy to fall into the single data point trap, especially when something recent or vivid is clouding your judgment. The 99% estimate was recency bias, where a belief gets unduly influenced by a recent event. Its close cousin is availability bias, where the examples that come to mind most easily, usually the vivid or painful ones, start to feel more likely than they are.
Almost a decade ago, I worked with someone who had been on the cybersecurity team at Equifax during its massive 2017 breach, in which the PII of about 147 million Americans was exposed through an unpatched Apache Struts system. Whenever I interviewed him to elicit forecasts about our environment, you could tell the experience had traumatized him. He rated everything, whether it was a data breach, ransomware, or just a simple outage, much higher than his colleagues did, and that was availability bias talking.
This is why I always say our job as risk analysts is as much psychology as it is science and math. A lot of these concepts are math-based, but how people perceive and respond to risk is deeply personal.
What to do
A few simple habits can help you stay out of the trap.
Check what each forecast is anchored on. If the data used traces back to a single number, audit finding, incident, or “something someone said,” that single data point is probably biasing the forecast and clouding the judgment of the estimators. Find more data points, even if it’s adjacent, external data that might not fit perfectly. The 99% estimate rested on one breach, and nearly two decades without a known breach never made it into the number.
Put a range around everything. Use your P5, P50, and P95, or minimum, most likely, and maximum if you’re using a different kind of distribution. Forcing yourself to think in ranges instead of a single number is an antidote to this kind of bias because, mentally, you and your SMEs will walk through the lowest and highest plausible numbers. A single observation can’t tell you how much a number can move, so a range built from Montreal alone wouldn’t have come close to 174. To set the top end of the forecast, you have to ask what events or conditions would push the U.S. medal count way up. The answer was a Soviet no-show.
With every risk forecast, ask yourself, “How could I be wrong? What would happen that would make my forecast wrong?” You can do this informally by asking yourself the question and brainstorming it out, or formally with a pre-mortem workshop, a technique from the psychologist Gary Klein that I’ve had some really good success with.
A pre-mortem is like a postmortem you hold before the decision. The classic version has everyone imagine the decision has already gone horribly wrong, then list all the ways it could have happened. That’s a great check on overconfidence, which was McDonald’s problem, but it pushes estimates in one direction, and the 99% analyst and my Equifax colleague were already too high. For a risk forecast, it can go both ways: “It’s a year from now, and our estimate was way off, too high or too low. Why?” That version tends to catch a lot of the bias and past trauma we bring into our estimates, whichever way it points.
Everything comes back to The Simpsons
The story was famous enough that one of my favorite shows, The Simpsons, did its own version in a 1992 episode called “Lisa’s First Word.” In a flashback to 1984, Krusty Burger runs an Olympics scratch-off game, and Krusty rigs the cards so they feature events that athletes from Communist countries are expected to win. Then the Soviets boycott, and Krusty loses $44 million in free burgers.
Krusty’s rig and McDonald’s forecast had the same weak spot, since both only worked if the Soviets showed up. Nobody at Krusty Burger asked how they could be wrong. McDonald’s at least had extra traffic due to the promotion, and ran the game again in 1988 and 1996.
A few updates
I’m speaking at two events this month:
Wednesday, October 14, at 2:00 PM ET (11:00 AM PT): ISSA’s Cyber Resilience Awareness Day Virtual Summit, which is free to attend online. My talk, What Nightingale Knew: The Question Behind Every Resilience Score, looks at what Florence Nightingale’s Crimean War charts can teach us about resilience scores, and at a very simple fix:. Register here.
October 22–23: I’m giving the keynote at SecureWV in Charleston, West Virginia. The Woozle Effect: How unsourced numbers sink good risk analysis. It’s a fun, lively talk where I show the ugly side of our industry’s most-cited numbers back as far as they go, and give a repeatable way to vet any data source before you use it. Use code TONY-AFTERHOURS10 for $10 off a standard ticket at securewv.org/shop.
I also want to properly introduce CRQ Bootcamp, the training program I’ve been building with Apps Garcia. It’s a series of live, belt-based classes built on the methods in From Heatmaps to Histograms, starting with your first risk analysis and working up through scenario scoping, calibration and decision framing. If this issue made you want to get better at building ranges, the calibration class is a good place to start. The curriculum, calendar and registration are all at crqbootcamp.com.
Last, I totally redesigned the book’s website. heatmapstohistograms.com now has the errata, high-res color versions of the book’s figures, and companion slides, and it’s where I’ll keep posting resources for readers.
Thanks for reading.
Tony