
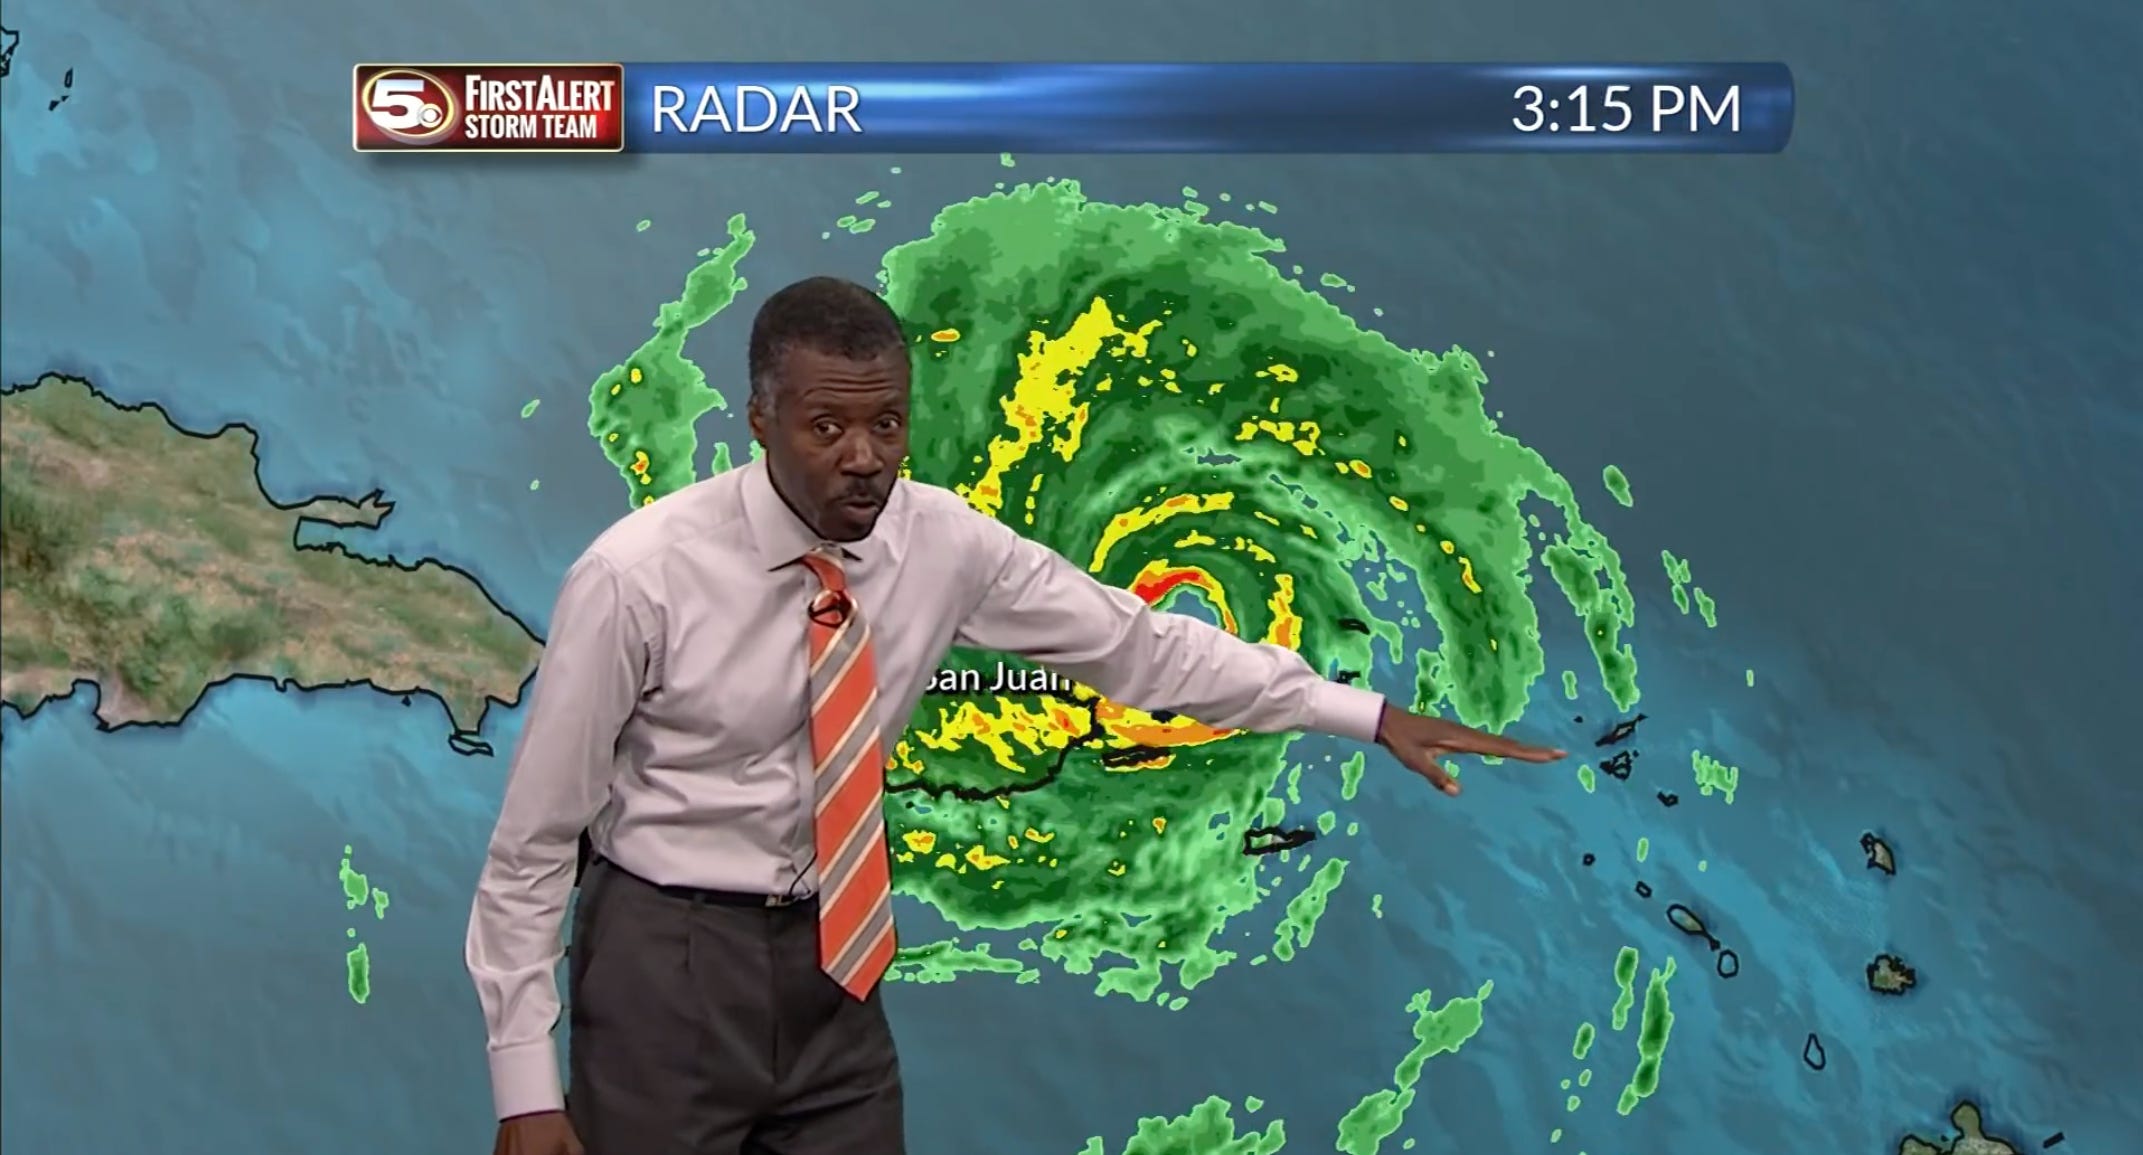
If you don’t have teenagers like I do, GOATed means Greatest Of All Time. In September 2017, the internet decided the GOAT of weather forecasting was a chief meteorologist in Mobile, Alabama named Alan Sealls. Hurricane Irma was crossing the northern Caribbean as a Category 5 with 185 mile an hour eyewall winds, Hurricane Jose was trailing it in the Atlantic, and Hurricane Katia was spinning in the southwestern Gulf. Sealls covered all three in a single four minute segment that hit the front page of Reddit, pulled in millions of views on YouTube, and earned him the title “Best Weatherman Ever.” Viewers compared his delivery to Bob Ross and Mister Rogers. He went on to retire from broadcasting in 2024 after 37 years and sixteen regional Emmys, and I will tell you where he ended up at the end of this post, because it is the perfect conclusion.
If you grew up where the local disaster is the ground shaking rather than the sky, like me, it is easy to miss how serious that picture was. Three active hurricanes in the Atlantic at once was the first such lineup in seven years, since Igor, Julia, and Karl in 2010, and Irma was no ordinary storm, ranking among the strongest hurricanes ever measured in the Atlantic. It had already flattened islands across the northern Caribbean and was pointed at Florida, all three systems were threatening land at the same time, and this was the same brutal stretch of weeks that brought Harvey’s flooding of Houston just before it and Maria’s devastation of Puerto Rico just after. That is what Sealls was calmly narrating, three correlated tail risks unfolding at once, with people’s lives depending on whether his audience understood each one.
The full September 2017 update. Watch how differently he handles what he knows versus what he does not.
I have watched this clip more times than I can count, and I come away thinking the same thing every time: this is a master class for risk analysts. Sealls does, live and on camera, the single hardest thing our profession is asked to do. He communicates deep uncertainty about the future while sounding completely, credibly confident, and he never loses the audience while doing it.
How risk analysts undermine themselves
I see risk analysts undermine themselves all the time during risk read-out meetings, and it almost always happens the same way: the moment someone challenges a number. I was in a risk report meeting not long ago where an analyst put a very well-supported figure on the screen, such as, we have a 10% chance of a major ransomware event this year. Someone pushed on it. Why ten? How do you know? Are you sure? The analyst folded on the spot. The data isn’t certain, they said, we don’t have great data, we’re not sure, we’ll take this back to the team and firm it up.
It didn’t matter whether 10% was the right number or not. The analyst retreated at the first sign of push-back. The data was good and the estimate was defensible, so nothing in that exchange called for surrender. Communicating uncertainty is just hard, because we are making claims about a future that has not happened yet, and the instant we get nervous about a range we start hedging, contradicting ourselves, and handing back the credibility we walked in with. Sealls never does that, so watch what he does instead.
Anchor on what you know
He opens with the things that are certain, and he states them flatly. The storm is a Category 5. It is about to pass north of Puerto Rico. The eyewall winds are near 185 miles an hour. There is no hedging on any of it, because none of it needs hedging. Laying down a firm baseline of established fact first buys enormous credibility for the uncertain claims that are about to follow, and this is the step most analysts skip, leading with caveats instead of facts and setting a nervous tone before they have said anything of substance.
Match your language to your confidence
Now listen to his verbs and qualifiers once he moves past the facts. Winds likely over 100 miles an hour. It could still be 150 as it approaches South Florida. It is possible the track bends more westerly. Jose may meander for several days. He’s very intentional about the words he chooses. Recall June’s newsletter issue where we talked about words of estimative probability, the spoken version of a numeric range. Sealls picks each word to match how sure he is. The stronger his confidence, the stronger the word, and when he is unsure he reaches for something softer like “could” or “possible” instead of hedging to cover himself.
He goes one step further, and this is the thing I want you to steal. He tells the audience which parts of his own forecast to trust less! He noted that wind speed is harder to predict than the storm’s direction. Inside a single forecast, he assigns different confidence to different components and says so out loud. Your loss frequency estimate and your loss magnitude estimate almost never deserve equal confidence, so tell your audience which one you’re more confident in. That kind of candor will be interpreted as competence.
The forecast is never done
My favorite line in the whole segment is easy to miss. The storm itself has not really changed what it’s doing, Sealls says. What has changed is our day-to-day assessment and projection. That is one of the simplest explanations of Bayesian updating I have ever heard, and it aired on local television between commercials.
Sit on it for a bit, and the whole Bayesian philosophy is in there. The storm is what it is. The forecast is our best current estimate of the storm, built from the data available today, and when tomorrow’s data arrives, the estimate will move even though the storm may not. The models do not control the weather, he reminds us. They are the attempt to keep up with it, calculate it, and regenerate another projection.
Sealls treats a revised forecast as the system working. Most organizations treat a revised risk estimate as evidence that the first one was wrong, and that framing is exactly backwards, because it teaches analysts to fear updating. The real loop is the one longtime readers know I never stop repeating: gather the best data available, make the forecast, let the decision be made on the information you had at the time, then keep refining as new information arrives. A risk analysis is never done. When your ransomware estimate moves from eight percent to twelve next quarter, you were not wrong in Q1. You know more now, so say it that way. Sealls compresses all of this into a sentence and delivers it in an ELI5 way. Once again, if you don’t have teenagers like I do, ELI5 means explain like I’m five.
Show the range, then narrate it
The graphics carry as much of the message as his words do, and every graphic on his screen is an uncertainty visualization.
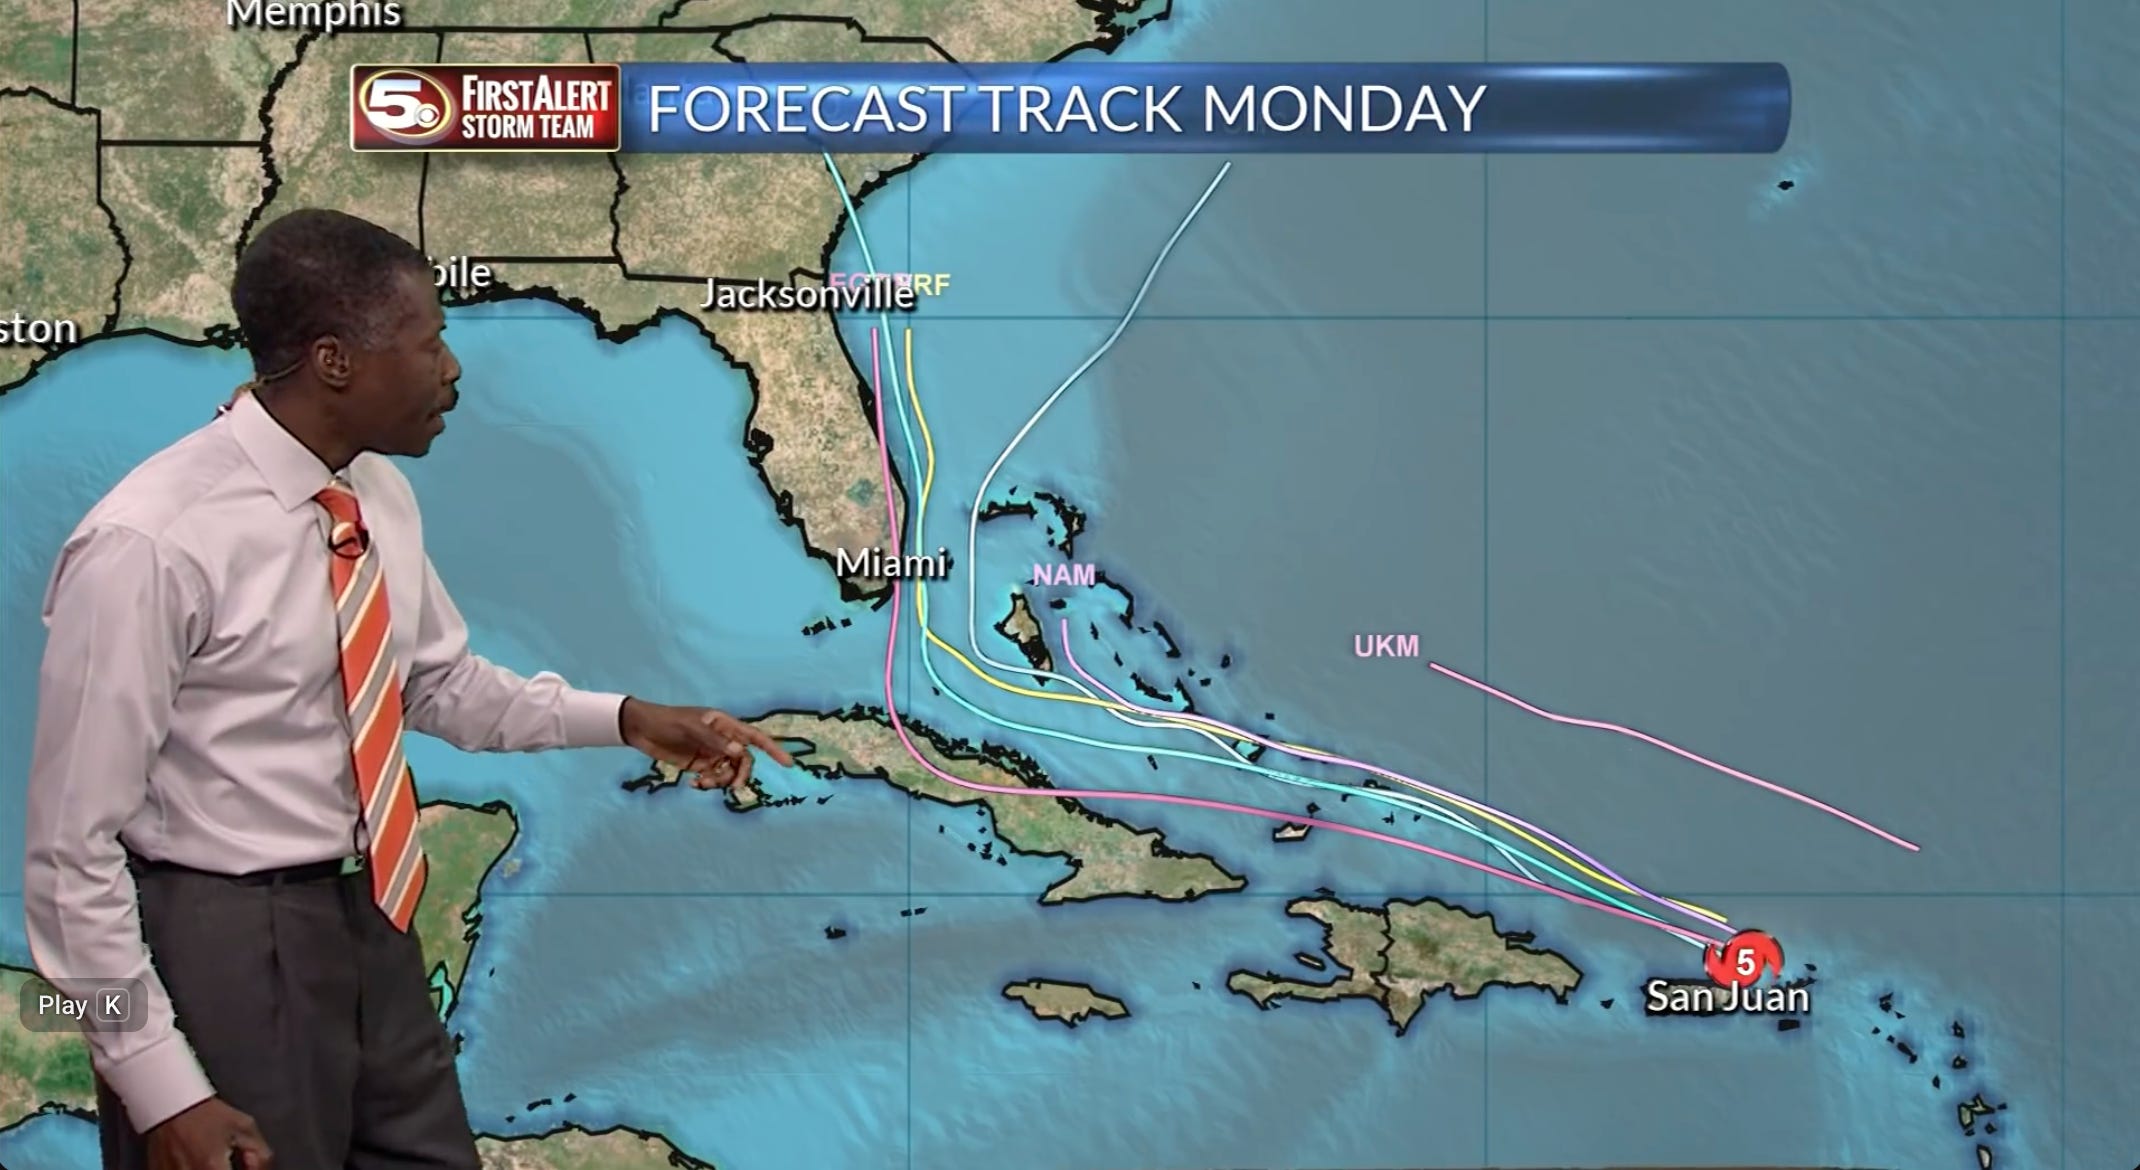
The spaghetti plot shows the model divergence. The cone of uncertainty widens with time because forecast error grows with time, and here is a detail for the calibration nerds in the audience: the National Hurricane Center sizes the cone so that two thirds of historical forecast errors fall inside it. It is a calibrated interval hiding in plain sight on your local news, and as of this hurricane season the NHC is piloting an experimental cone that widens the interval to capture 90 percent of tracks, which means a public agency is openly debating which credible interval to publish.
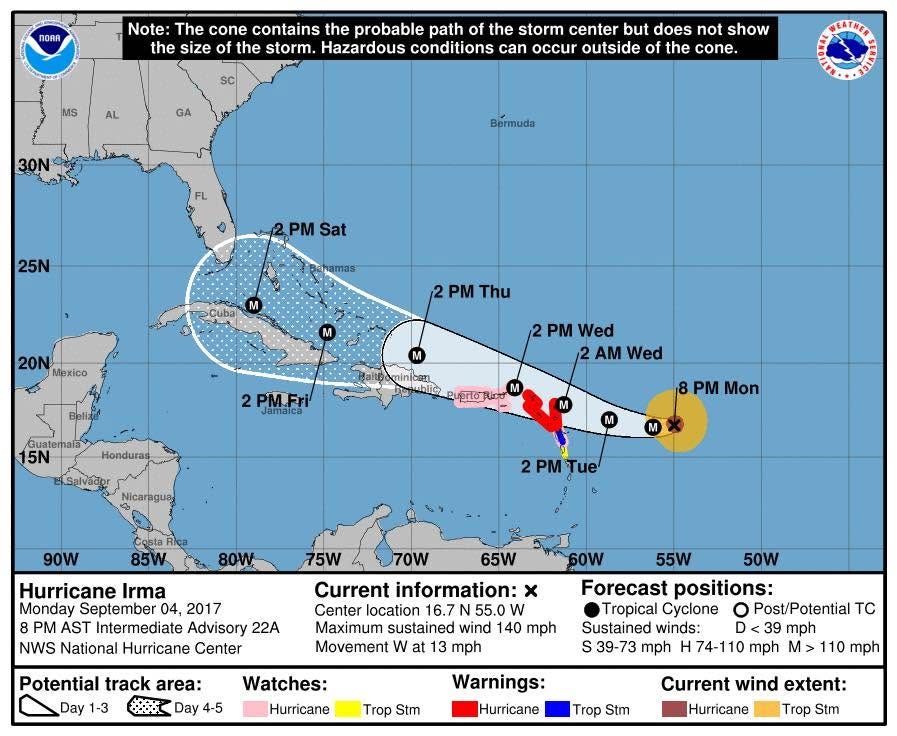
There is a lesson in the cone, too: outside the cone does not mean safe. The cone is one of the most misread graphics in America, with plenty of viewers assuming outside the cone means out of danger, which is why Sealls narrates exactly what each graphic does and does not say. Never let a chart speak unaccompanied.
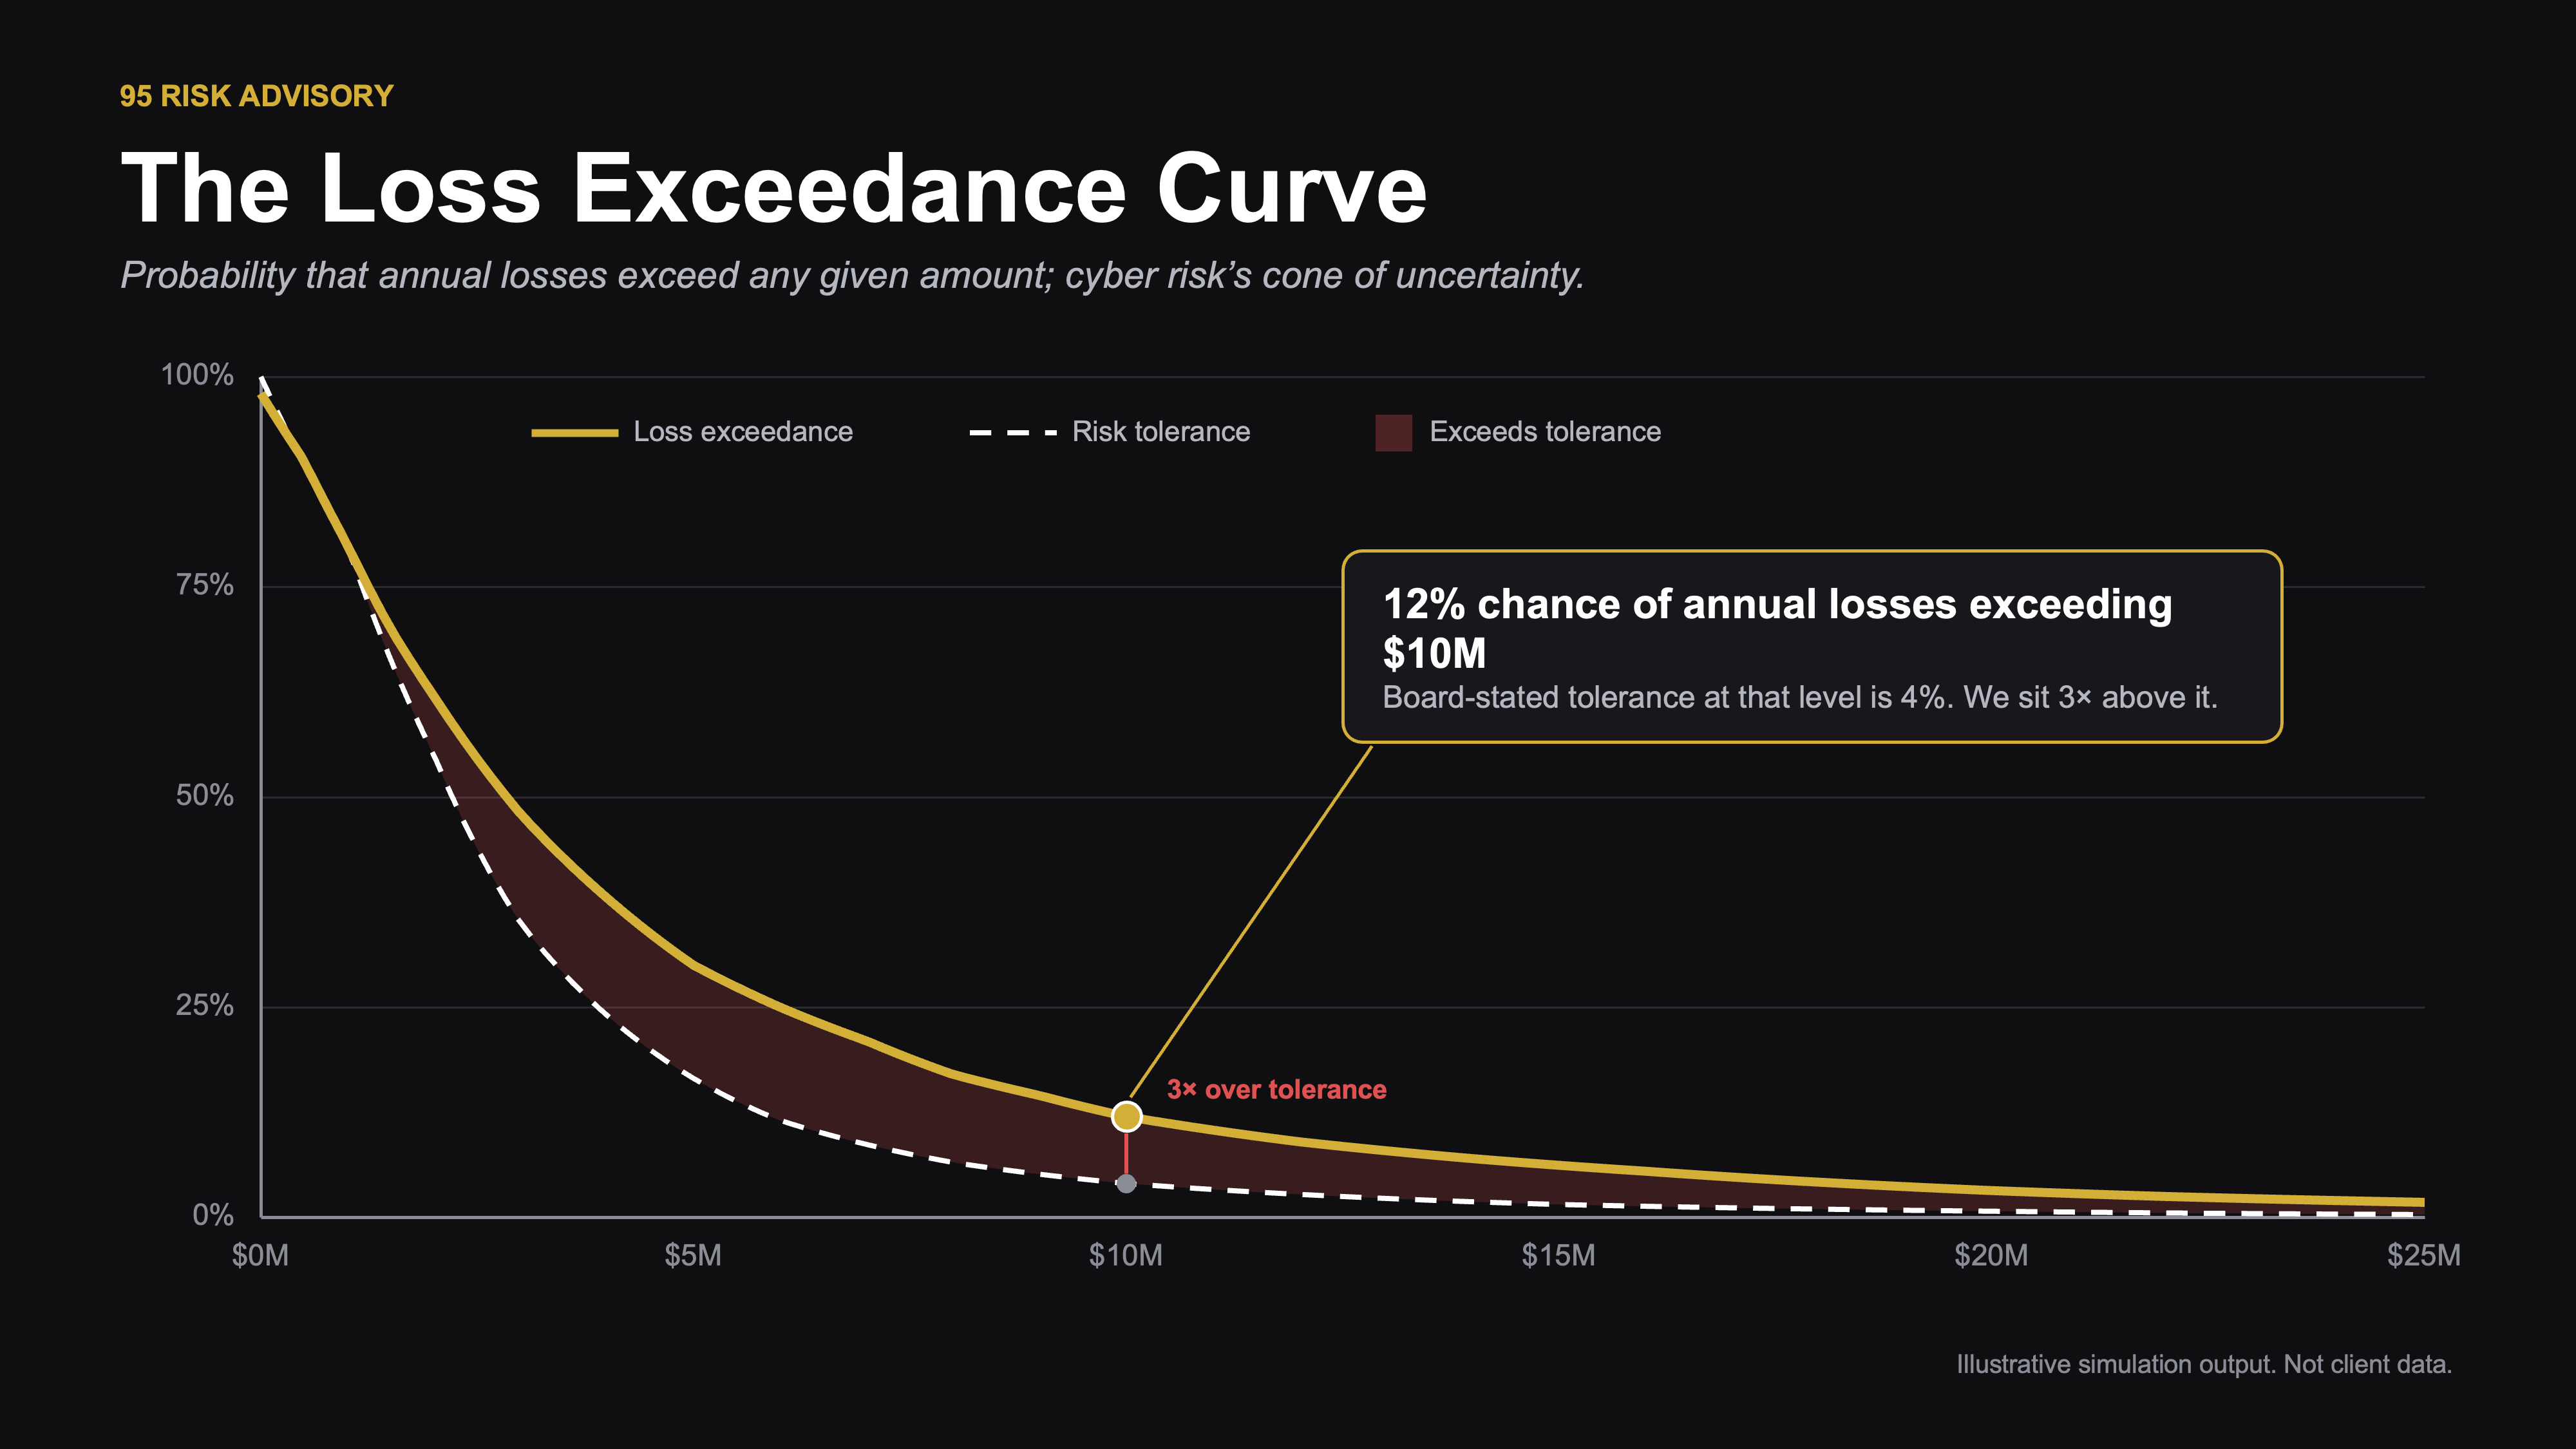
Our equivalent is the loss exceedance curve. It is one of the best methods we have to put uncertainty about the future in front of an executive in a form they can absorb in seconds. It is our cone and our spaghetti plot in one picture, showing the range, the tail, and the shape of what we do not know without asking anyone to read a probability distribution. Overlay the risk tolerance curve, and the picture answers the next question too, whether the risk we hold sits inside the risk we agreed to accept. A fair objection is that weather models are validated against reality every single day and ours are not, and that is true, but it works the other way as well. The less validated our models are, the more disciplined our communication of uncertainty must be.
Tell them what to do
Sealls also tracks a portfolio rather than a single risk. In four minutes he follows three hurricanes at once, each with its own probability and its own graphic, and the audience stays with him the whole way. When the implicit question becomes how unusual this is, he reaches for history, pointing to past seasons when three storms crowded the map at the same time. That is the outside view, explaining the concept of base rates without ever using the term.
Then he closes the way every good forecast closes. If you are in the cone, have a plan right now. If you are outside it, keep your usual hurricane season plan. He tells you what to do about the uncertainty, and our version of that is resilience, the controls and the response capability that make the range survivable no matter where the storm finally lands.
Where is Alan now?
One more thing about Alan Sealls, because I promised you a satisfying conclusion. The man Reddit crowned Best Weatherman Ever finished his broadcast career, retired from the anchor desk in 2024, and this year is serving as president of the American Meteorological Society. Clearly, not a coincidence.
I’ll leave readers with the lessons I learned from Sealls through watching his reporting: hedging is not humility, and overprecision is not confidence. State what you know plainly. Modify your language on what you don’t. Show the range, narrate the graphic, and tell people what to do about it.
Whether you are a risk analyst, a CISO, or something in between, if risk communication is any part of your job, watch the clip. It runs four minutes and it is worth your time, and if you go in with these lessons in mind, you will see him land every one of them.
The next time someone in a meeting asks whether you are sure, you do not have to fold. You can do what the GOAT does.
👉 Before you go
If this cleared something up, do me a favor and forward it to the one person on your team who still reports risk in reds, yellows, and greens. The next time you present a number you are not certain about, try Sealls’s playbook: state what you know plainly, match your language to your confidence, show the range, and tell people what to do about it. Want to see how calibrated your own probability words are before you try? Take the words of estimative probability challenge.
📘 Get the book
From Heatmaps to Histograms is out now, and it hit #1 in Amazon’s Computer Network Security category. It is available anywhere books are sold, anywhere in the world, so you can order the paperback from your neighborhood bookstore, and if you are lucky enough to have an independent shop nearby, please buy it from them. Bookshop.org is the online option that routes its profits to local bookstores, so ordering there supports indies too.
Here is where to find every format:
Amazon · Paperback
Springer · Paperback · ePub · PDF
Barnes & Noble · Paperback · ebook (NOOK)
Bookshop.org · Paperback, and it supports local bookstores
O’Reilly · Read online · subscription
🎤 Where I’ll be speaking
I have a busy stretch coming up, and I would love to see you at any of these.
Black Hat USA (Las Vegas): I’ll be signing copies of the book at the Black Hat Bookstore on Thursday, August 6 at 10am. Come by and say hello.
DEF CON 34 (Las Vegas): Two things this year.
Noob Village workshop, Friday, August 7 at 2pm: a hands-on, 90 minute introduction to quantitative risk for absolute beginners, no background required. Time to be announced.
Book signing: Friday, August 7 at 11am at the DEFCON bookstore.
ISACA Sacramento Flagship Conference (Sacramento, CA): Friday, September 18 at 10:55am, a talk called “Beyond the Heat Map: An Introduction to FAIR for Security Teams.” A ground-up intro to FAIR for security teams at every level, ending with a complete ransomware assessment built live. The conference runs September 17 and 18 at the Wyndham Sacramento.
Quantify SLC (Salt Lake City, UT): A free event with me and Jack Jones, the creator of FAIR, on the program. I’m running a workshop, giving a talk, and sitting on a panel, so grab a seat while they last. All attendees get a free copy of our respective books.
✉️ Contact
Have a question about this, or anything else? Here is how to reach me:
Reply to this newsletter if you are reading by email
Comment below
Connect with me on LinkedIn
🌐 Elsewhere
I share shorter thoughts on risk, metrics, and decision-making on LinkedIn.
Book updates, chapter summaries, tools, and downloads are at heatmapstohistograms.com.
My longer-form essays and older writing live at tonym-v.com.
Thanks for reading,
Tony